Fish Head to Body Ratio Calculator
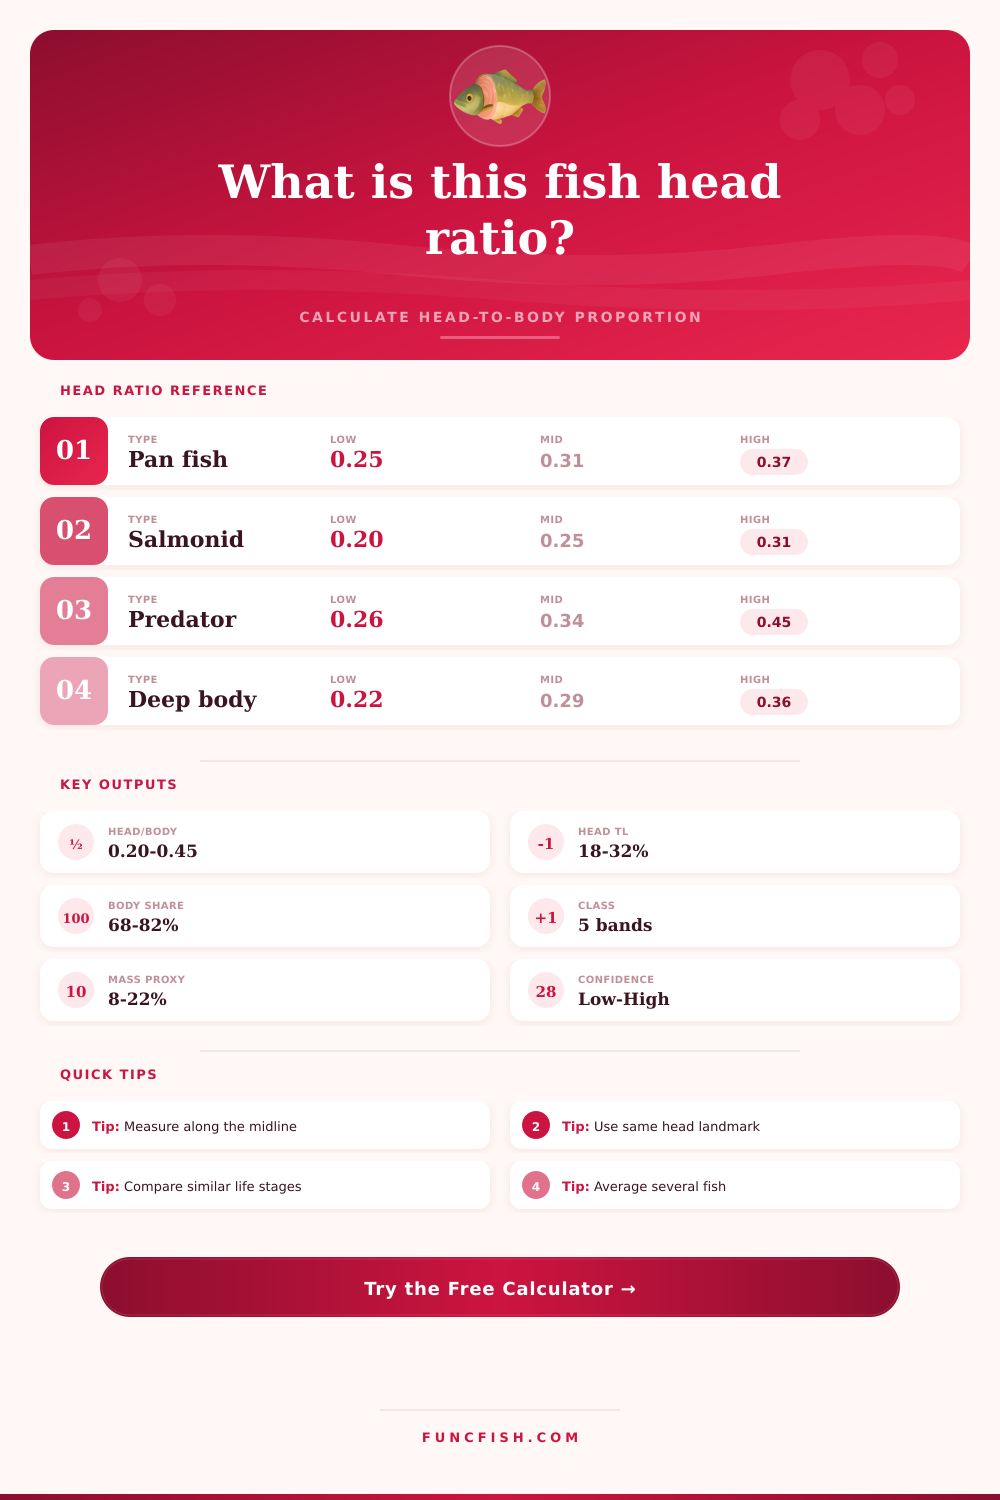
Calculate head-to-body ratio, head share of total length, body share, morphotype band, and sample confidence from field or lab fish measurements.
📌Measurement presets
⚙Ratio inputs
Fish proportion results
Calculation breakdown
📏Live measurement grid
Total or standard length used for percentage shares.
Body depth divided by total length.
Post-head body length as a share of total length.
Driven by sample count, spread, and measurement uncertainty.
📊Comparison grid
Best when head length and post-head body length are measured from the same landmark.
Useful for morphology notes, illustrations, and comparing different length classes.
Deep-bodied fish can show a similar ratio while carrying more mass behind the head.
Difference from the adjusted midpoint for the selected species and life stage.
📘Reference tables
| Species profile | Typical head/body ratio | Head share of total length | Interpretation note |
|---|---|---|---|
| Bass and sunfish predators | 0.28 to 0.40 | 22% to 29% | Large mouth and operculum make head proportion moderately high. |
| Trout and salmonids | 0.20 to 0.31 | 17% to 24% | Streamlined body shape usually keeps head share lower. |
| Catfish and benthic feeders | 0.33 to 0.52 | 25% to 34% | Broad skull, barbels, and flattened head can lift the ratio. |
| Pike and elongate predators | 0.24 to 0.40 | 20% to 29% | Long jaws can raise head length while body depth remains low. |
| Carp and cyprinids | 0.22 to 0.34 | 18% to 25% | Adult condition and body depth change the visual impression. |
| Measurement method | Head endpoint | Expected bias | Use when |
|---|---|---|---|
| Snout to rear operculum | Back edge of gill cover | Standard and repeatable | Field measurements and specimen photos. |
| Snout to cleithrum notch | Pectoral girdle notch | Slightly longer head | Detailed lab morphology or preserved specimens. |
| Snout to gill slit | Visible gill opening | Can shorten head length | Fast checks where operculum edge is hard to mark. |
| Photo scaling | Pixel landmark line | Depends on camera angle | Side-view images with a ruler in the same plane. |
| Preserved specimen | Same as protocol | Shrinkage may lower length | Museum, lab, or archival measurements. |
| Life stage | Common effect | Calculator adjustment | Comparison caution |
|---|---|---|---|
| Juvenile | Head often appears large for body | Raises reference midpoint | Compare with same age class. |
| Subadult | Rapid body growth lowers ratio | Slightly above adult midpoint | Growth rate and feeding can blur bands. |
| Adult | Reference condition | No stage adjustment | Use for most field survey comparisons. |
| Spawning adult | Body depth and abdomen may rise | Lowers apparent head dominance | Note sex and maturity with the ratio. |
| Old large adult | Jaw or skull may look larger | Slightly raises midpoint | Length class should be recorded. |
| Output | Formula | Best use | Watch point |
|---|---|---|---|
| Head/body ratio | Head length / body length | Comparing proportional shape after the head. | Must use the same landmark for both lengths. |
| Head total share | Head length / total length x 100 | Quick morphology percentage for reports. | Total length and standard length are not identical. |
| Body share | Body length / total length x 100 | Checks whether the entered lengths are consistent. | Tail fin inclusion changes the denominator. |
| Head mass proxy | Weight x adjusted head volume share | Rough handling or morphology estimate. | Not a dissected head weight. |
💡Calculation tips
When you enter your measurements into the calculator, it does all the number crunching for you; no guessing required as to if your sample falls in ranges you’d expect. It’s also that moment when you’re looking at a fish and thinking its head is comically oversized compared to the body it’s attached to. And this moment happens to us all, biologists, anglers, or anyone who has tried to draw a trout from memory.
A lot of times it boils down to knowing how much bigger versus just big. That is: proportion. And biology is way too nuanced for a one-size-fits-all approach. So the tool helps adjust those reference bands based off the method you choose, ensuring you aren’t comparing apples to oranges.
How the Tool Works
Where do you mark the head? This is the first part of the trick and has been the subject of debate by biologists for decades. Is it at the back edge of the operculum? Is it at the cleithrum notch just past the pectoral fin? In practice, the exact point isn’t important as long as you’re consistent. A few millimeters difference on the starting point can move your ratio by enough to push a fish from one morphotype category into another. As long as you make all measurements to the same point, even an arbitrary starting point won’t mess things up as much. So when using the tool you’ll be able to choose which way you want to measure and it will adjust the reference bands appropriately.
Another aspect overlooked by many angler but that is really important is life stage. Even within species, the ratio can vary greatly depending on age. Juveniles often have relatively oversized heads in proportion to their small size. As the fish mature, their skull stays roughly the same while the rest of the body grows faster. So the ratio decreases with age. An adult bass has a proportionally smaller head than a fingerling of the same species. Looking at just absolute head length between a young and older fish would lead you down a rabbit hole thinking the old fish had better genetics or was healthier or whatever else. By allowing you to select if your fish is an adult, sub-adult or even a juvenile, the calculator adjusts those expectations based on what the fish’s size is supposed to be at each age. Then it shows you how far along that fish is on its own development curve.
It turns out there’s more to it than that; body condition does come into play as well about how those proportions look. When a fish has a full belly (or ripe eggs, etc.), even if they’re still “fat”, their body looks relatively small compared to their head, which can cause the head to be perceived as disproportionally large in relation to the rest of them because the denominator increased. If they shrink their belly (like a leaner post spawn), then the opposite happens, all head, no body. It’s not actualy a change in their skeletal structure but rather a change in where the mass is distributed. That’s why we’ve included the mass proxy feature which tries to help you understand what portion of the mass that head represents relative to what you input, helping to distinguish between a permanent morphological trait vs. A bloat due to seasonality.
The silent killer of good data is sampling error. One fish provides an anecdote; eight provide a trend. The calculator asks for the observed spread and sample count to tell you how much trust to place in the resulting number. An outlier can be just as much an outlier with only one measurement, whereas a dozen specimens yield an average that tells us something about the larger population. When there’s high variance, it means your confidence level is dropping. You should of had more data before coming to any sort of firm conclusion. These numbers matter if you are making decisions based on them.
In the end though, fish head ratios is at least as much about pattern recognition as math. For some they can reveal species identity in dirty water. They can also show abnormal growth rates. They might also stem from just plain old curiosity about what you’re catching. Not everyone needs an ichthyologist’s degree to appreciate how something looks like it’s supposed to look. But having a framework does give meaning to the observation. And that is where this tool delivers: a framework for understanding the messy field notes and turning them into clean data that can be compared.
Next time you measure one of your catches, spend an extra few seconds examining the entire picture. What’s the landmark? Is this fish in the correct life stage? Did you account for its body condition? Perhaps that big-headed creature is just a juvenile filling out into its bones. Or maybe not. If you know what to look for, the proportions will give it away.