Fish Home Range Size Calculator
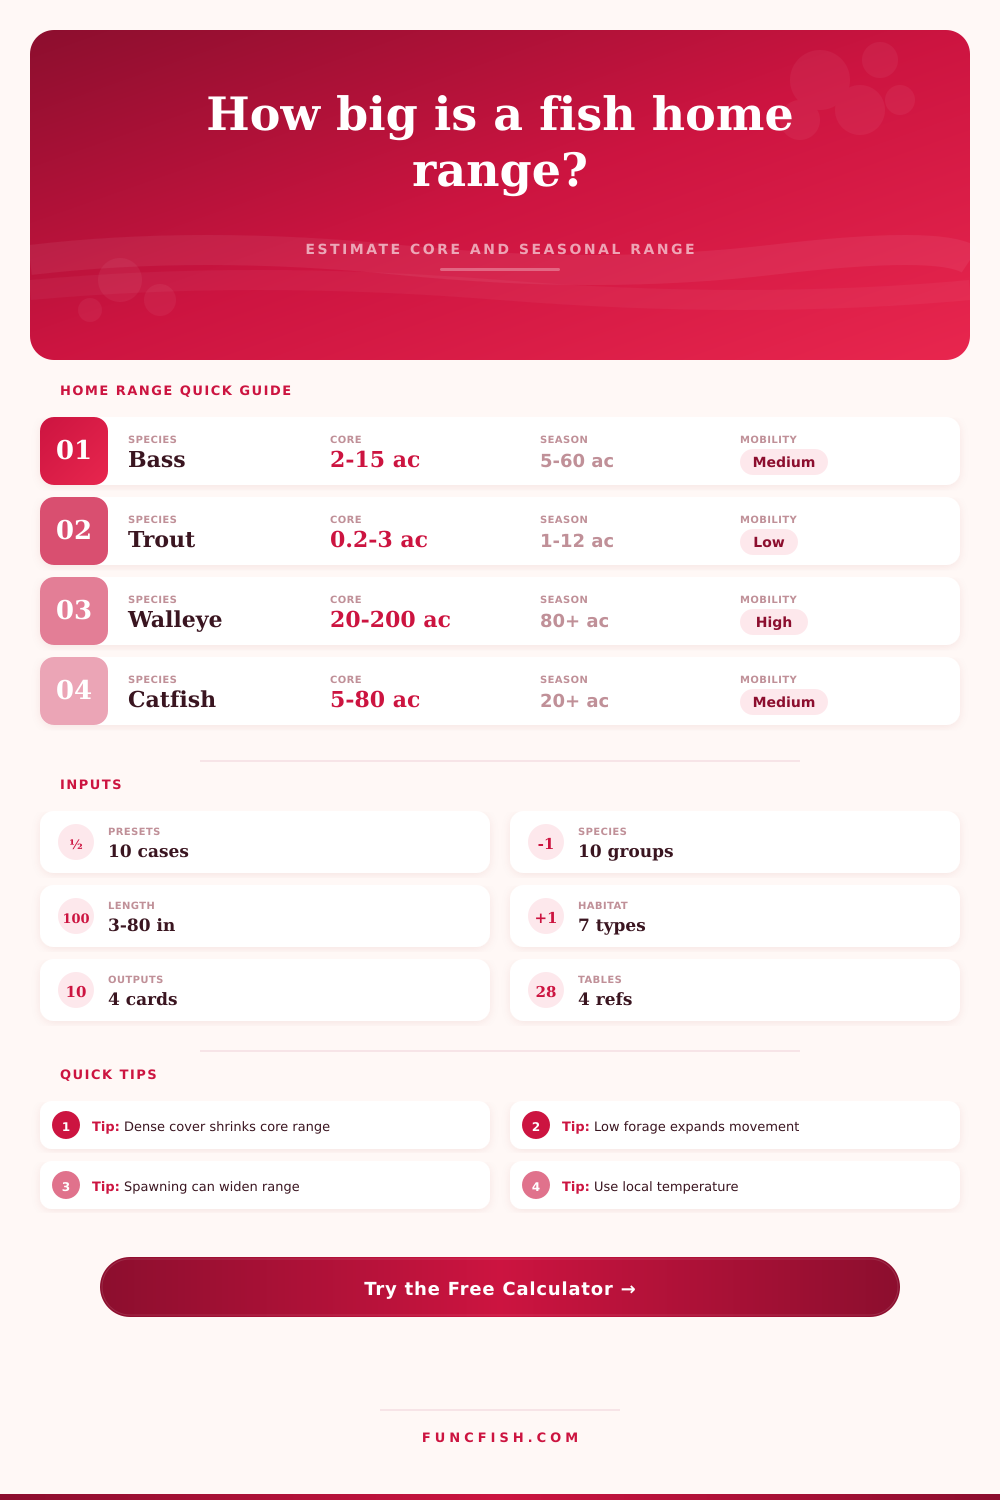
Estimate a fish's core holding area, seasonal home range, movement radius, and shoreline reach from species mobility, body size, habitat complexity, forage density, cover, temperature, flow, season, and fishing pressure.
🏷Home range labels
📌Home range presets
⚙Species, size, and habitat inputs
Home range estimate
Calculation breakdown
📊Species mobility grid
📐Reference tables
| Species group | Typical core range | Seasonal range behavior | Best use note |
|---|---|---|---|
| Black bass | 2 to 15 acres / 0.8 to 6.1 ha | Moderate expansion around spawn and forage shifts | Works best for lake coves, points, docks, and weed edges |
| Resident trout | 0.2 to 3 acres / 0.08 to 1.2 ha | Often linear in streams, wider in lakes | Use shoreline reach more than circular radius in streams |
| Walleye | 20 to 200 acres / 8.1 to 81 ha | Large seasonal moves across reefs, basins, and bait routes | Open reservoirs need larger seasonal multipliers |
| Catfish | 5 to 80 acres / 2 to 32 ha | River fish may use long corridors | Current breaks and deep holes strongly shape movement |
| Panfish | 0.2 to 5 acres / 0.08 to 2 ha | Small core unless vegetation or oxygen shifts | Good for ponds, weed pockets, brush, and docks |
| Habitat condition | Core effect | Seasonal effect | Interpretation |
|---|---|---|---|
| Complex weeds, wood, rock, docks | Shrinks core by concentrating food and refuge | Moderate seasonal range if nearby depth exists | Expect repeatable holding areas |
| Patchy separated habitat | Expands core and travel paths | Strong seasonal expansion | Fish may rotate among multiple patches |
| Linear channel or bank corridor | Area may look small but reach is long | Seasonal reach can be very long | Use the shoreline reach result |
| Open basin with roaming bait | Expands daily range | Very strong expansion | Position follows bait more than cover |
| Input signal | Range gets smaller when | Range gets larger when | Watch for |
|---|---|---|---|
| Forage | Forage is dense and stationary | Forage is scarce or schooling | Roaming bait can dominate the model |
| Temperature | Water is near preferred range | Fish must find thermal refuge | Warm-water stress often narrows feeding but widens relocation |
| Current | Moderate current creates feeding lanes | Fast current forces refuge hopping | River fish convert area into corridor length |
| Pressure | Sanctuary cover is available | Disturbance pushes fish between spots | Repeated boat traffic can move fish off shallow cores |
| Result band | Core area signal | Seasonal signal | Fishing map meaning |
|---|---|---|---|
| Tight | Under 3 acres / under 1.2 ha | Nearby seasonal shifts | Return to exact cover, shade, or depth breaks |
| Moderate | 3 to 25 acres / 1.2 to 10 ha | Several adjacent locations | Build a small milk run around the core |
| Broad | 25 to 150 acres / 10 to 61 ha | Multiple habitat zones | Search by structure group and forage lane |
| Roaming | 150+ acres / 61+ ha | Basin or corridor scale | Track bait, flow, and seasonal routes first |
💡Calculation tips
Range tip: Treat the core area as the repeat-use zone and the seasonal range as the wider map neighborhood. A fish may visit the seasonal range only during feeding, spawning, temperature shifts, or disturbance.
Map tip: In rivers, creeks, canals, and tidal channels, the shoreline reach result is usually more useful than the circular radius because fish movement follows edges, current breaks, and depth lanes.
A lot of times you get to an area that looks good on the map but it has no fish. Then you’ll drop your bait where the contour lines show the fish should be and you can’t catch them. That’s typically not a spot issue; that’s a dynamics versus statics issue. They’re living in dynamic areas and you’re thinking in static terms.
Their home range is not a fixed circle on your chartplotter; it’s an expanding and contracting zone based off safety, temperature and hunger. So how does this work? The calculator figures it out for you, but knowing what it’s doing help you make smarter choices.
How to Find Fish by Understanding Their Habits
Fish are not swimming around haphazardly. They’re catching calories, while burning off energy. In an open reservoir, a big walleye must cover large areas of water in search of prey. So the tool considers not only species mobility, but also body size. A bigger walleye will have greater metabolic requirements. It can’t sit in a small cove scraping by; it has to roam about.
However, place that same walleye in a complicated habitat such as heavy weeds and rock structure, and its core range decrease. The food is concentrated, thus it doesn’t have to travel as far to meet its energy needs. Most folks think size of fish equals size of its territory. This is true sometimes, especially in sparser habitat. In denser habitat, even a trophy bass will hold to a few acres.
So how does that get captured with the tool? It works by allowing you to enter forage and habitat. When forage is dense and stationary, the fish remains in place. When forage is moving and schooling, the fish moves too. That shifts strategy. You’re no longer fishing a home range when you’re fishing for striped bass that chase bait schools. You’re fishing a highway.
The seasonal range output becomes your primary guide different than the core area. The seasonal range output directs your efforts instead. The season you are in also has a huge impact on this equation. Fish is more energy conscious in the winter. They hug slow current lanes or deep structure. And their range gets smaller. In the fall, they’re roaming. They are preparing for the winter by eating there faces off. And their range explodes.
The calculator accounts for this seasonal activity. It isn’t simply a matter of what the fish is doing today. But rather what has the fish done and where is he heading? You could of have a fish in late summer whose range is small because it’s hiding from the heat. But come September when the water cools down that same fish may begin to cover several hundred acre looking for shad.
The other hidden variable is angling pressure. Fish will be driven off their perfect core area on a heavily fished spot. To escape boat noise, they may pull back into deeper, more uncomfortable water, or they may slide over to nearby cover. That expands their effective range or makes it unpredictable. The tool takes this disturbance factor into account. It reminds us that fish aren’t simply a biological machine. They’re aware, and they respond. When you’re fishing a tournament hot spot, assume the fish has been pushed either deeper or further than their normal cover.
When you get it, it’s no longer a frustrating day. Rather than spend three hours casting to a single area, you begin considering corridor routes. You think about how that fish got from his winter hole to his summer feeding area. Where does it stop and start? Where is there cover? Where is there change in depth? This is all shown plainly on the page with the different species reference tables.
Bass hold tighter then walleye. Trout tend to be more linear in streams but broader in lakes. These are not hard and fast rules, but they are good patterns nonetheless.
So it’s all a numbers game really. It is about fishing. You are trying to be where you need to be when you need to be there. Once you understand how pressure, forage and temperature affect their home range, you no longer have to guess. Now you can predict. These fish aren’t hiding from you. They’re simply going through their day. Get on the same wavelength as them and the bites will follow. It’s not magic. You are just paying attention to what matters.