Fish Metabolic Rate by Temperature Calculator
Estimate temperature-adjusted oxygen consumption, tank or holding load, Q10 multiplier, and stress margin for fish groups using mass scaling, activity, acclimation, salinity, and dissolved oxygen.
🐟 Metabolic temperature presets
⚙ Fish, water, and trial inputs
Temperature-adjusted metabolic estimate
Calculation breakdown
📊 Live model comparison grid
Cold side rate
Rate at 5°C below the selected water temperature.
Selected rate
Current temperature estimate for one fish.
Warm side rate
Rate at 5°C above the selected water temperature.
Oxygen cushion
Available dissolved oxygen compared with comfort need.
🌡 Species temperature model cards
Cold-water fish often show sharp oxygen demand increases above their preferred range.
Warm-water sport fish tolerate warmer water but still need extra oxygen during peaks.
Hardy pond species often have lower thermal sensitivity but high loads at heavy biomass.
Tropical fish are efficient in warm water until temperatures approach upper comfort limits.
📘 Reference tables
| Species group | Reference rate | Typical Q10 | Optimum range | Oxygen comfort |
|---|---|---|---|---|
| Trout / char | 190-260 mg O2/kg/h | 2.1-2.4 | 10-16°C / 50-61°F | 7+ mg/L |
| Bass / sunfish | 110-180 mg O2/kg/h | 1.8-2.2 | 22-29°C / 72-84°F | 5+ mg/L |
| Salmon / steelhead | 170-240 mg O2/kg/h | 2.1-2.5 | 8-15°C / 46-59°F | 7+ mg/L |
| Carp / koi | 80-140 mg O2/kg/h | 1.6-2.0 | 20-28°C / 68-82°F | 4+ mg/L |
| Catfish / bullhead | 90-160 mg O2/kg/h | 1.7-2.1 | 24-30°C / 75-86°F | 4+ mg/L |
| Tilapia / cichlid | 110-180 mg O2/kg/h | 1.7-2.1 | 26-31°C / 79-88°F | 4.5+ mg/L |
| Adjustment | Low setting | Middle setting | High setting | Calculator use |
|---|---|---|---|---|
| Activity | Sedated 0.78x | Routine 1.00-1.45x | Crowding 3.2x | Multiplies oxygen rate after Q10 |
| Feeding | Fasted 0.92x | Maintenance 1.00x | Heavy meal 1.38x | Accounts for digestion demand |
| Acclimation | Long 0.94x | Stable 1.00x | Abrupt 1.18x | Raises demand after temperature shifts |
| Life stage | Fasted adult 0.86x | Adult 1.00x | Juvenile 1.18x | Reflects growth and stress state |
| Salinity | Near iso-osmotic | Fresh or marine | Mismatch high | Osmoregulation penalty |
| Temperature condition | Metabolic signal | Oxygen implication | Interpretation | Calculator flag |
|---|---|---|---|---|
| Below preferred range | Lower demand | More oxygen cushion | Growth and feeding may slow | Cold-side check |
| Near optimum | Efficient demand | Routine load predictable | Good comparison zone | Best margin |
| Above optimum | Rising demand | Aeration load increases | Watch night and dawn oxygen | Warm penalty |
| Near upper range | High demand | Low safety cushion | Handling becomes risky | Stress flag |
| Low dissolved oxygen | Ventilation stress | Demand may exceed supply | Reduce activity assumptions | Oxygen flag |
| Use case | Best duration | Key input | Result to watch | Suggested check |
|---|---|---|---|---|
| Livewell or hauling | 1-12 hours | Crowding activity | Group oxygen load | Calculate warmest hour |
| Aquaculture tank | 24 hours | Fish count and feeding | Daily g O2 | Separate size classes |
| Pond fish survey | 24 hours | Water temperature | Thermal multiplier | Compare dawn oxygen |
| Lab respirometry | 0.5-6 hours | Reference rate | mg O2/kg/hour | Use acclimated fish |
| Thermal stress screen | 24 hours | Upper thermal limit | Stress margin | Run cool and warm cases |
✅ Calculation tips
You have seen trout in buckets sitting there still, until you move the bucket into the light and the fish gasp for breath. They didn’t just get stressed or suddenly become hungry. But they needed more oxygen as water warmed up. As temperature rise ten degrees, the need doubles. Metabolism is dictated by temperature more then any other variable. Manage fish health through thermostat, not feeding schedules.
You input your target temperature and type of species. The calculator do the rest. No need to guess how much oxygen are required.
Manage Fish Health with Temperature and Oxygen
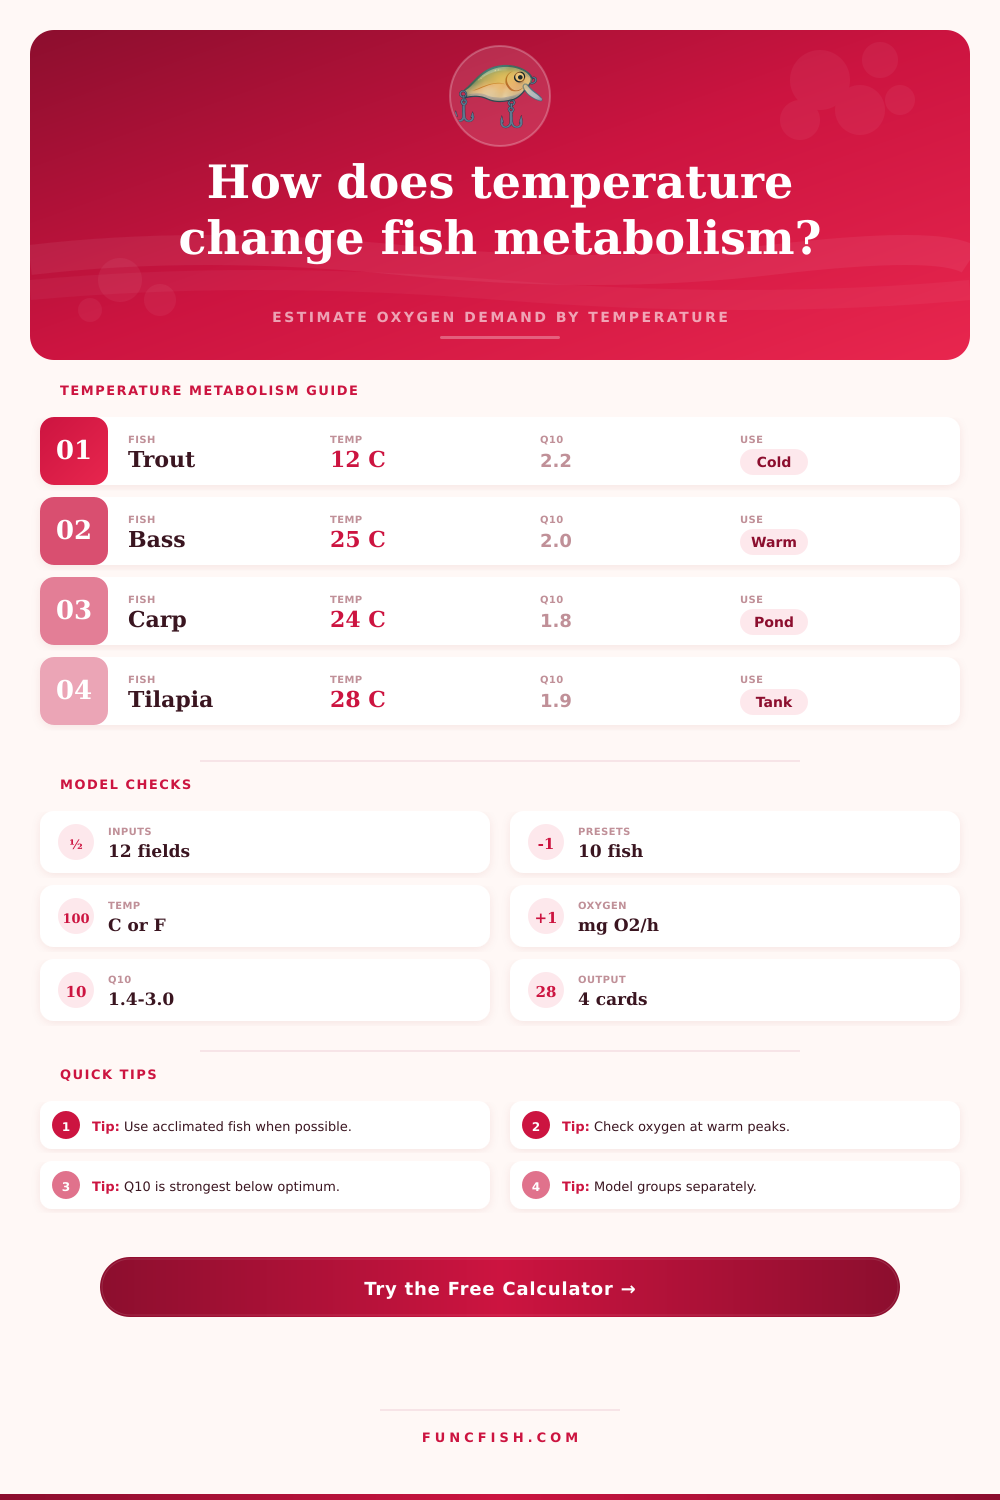
Oxygen demand at rest goes up with the temperature. Metabolic rate increases based off a Q10 coefficient. This coefficient measures increase in metabolic rate per ten-degree rise. For most coldwater species (like trout), it’s frequently 2.2. Their oxygen demand nearly double at rest for every ten-degree rise in water temperature. If you hauled them in during summer months, you would of have to keep pace with the increased need by supplying enough oxygen or else the tank won’t have enough air.
Thermal context is sometimes missed with dissolved oxygen reading. If it’s hot, fish will use high oxygen content fast, making it less useful. It accounts for acclimation and activity. Moving a fish suddenly from a cool pond to a warm tank puts an added metabolic cost on its body. Acclimated fish has a lower basic demand for oxygen compared to a fish that hasn’t been moved to a stable environment. When you need to stretch out a transport window, this detail become important.
New aquaculturists also run into the problem of mass scaling. Fish don’t use oxygen in direct proportion to weight. In fact, a ten pound bass doesn’t breathe ten times what a one pound bass do. This is reflected in the exponent of roughly 0.78 used in the calculator. As fish increase in size, oxygen demands per kilo decreases. If you’re raising carp or tilapia and just multiplying juvenile consumption by your fish growth, you’ll overaerate and waste energy. You have to consider efficiency gains.
Salt changes things again. In freshwater, fish has to actively work to hold onto salt; in seawater, they must work to get rid of too much salt. Doing this use energy and requires more oxygen. You can account for this with the tool. Whether your cages sit on the ocean floor or a fresh water nursery, the tool makes sure your calculations is correct.
Though you may not think about water chemistry when thinking about temperature, the fish feel all of it. Note the output of the stress margin. If it’s not in the green, your system is hanging by a thread. The fish are fine today, maybe even over-oxygenated with a safety net. But take away sunlight and photosynthesis cease. Or hit the pond with heat and surface temperatures rise. Then that buffer is gone.
Typical range values for popular species appear in reference tables. Compare your custom input to these values to make sure they is right. Where does a comfortabley trout live? Where do bass start to struggle? Use those points to check your own configuration.
The trick here is to turn the blower on when the fish are NOT showing signs of distress. That’s predicting the need rather than responding after a problem has occurred. Understanding the metabolism drivers (temperature, mass, salinity) prevents you from guessing at your oxygen levels. Instead, you begin to manage them directly.
Spreadsheets don’t matter to fish. What matters is tanks that maintain their thermal comfort zone. Oxygen is high and the water is cool. The rest will be taken care of by the biology.