Fish Net Energy Gain Calculator
Estimate whether feeding intake leaves a usable surplus after metabolism, swimming activity, digestion, oxygen stress, and spawning allocation.
📌Energy scenario presets
⚙Net energy inputs
Net energy gain estimate
Calculation breakdown
📊Energy profile grid
Warmwater predator
Coolwater predator
Omnivore / benthic
Spawning adult
📐Reference tables
| Species profile | Preferred temperature | Metabolic pattern | Tissue energy used |
|---|---|---|---|
| Largemouth bass | 74-82°F / 23-28°C | Moderate warmwater predator cost | 5.8 kJ/g wet gain |
| Rainbow trout | 50-60°F / 10-16°C | Coolwater cost rises sharply when warm | 5.6 kJ/g wet gain |
| Channel catfish | 78-86°F / 26-30°C | Efficient warmwater omnivore | 6.2 kJ/g wet gain |
| Walleye | 62-70°F / 17-21°C | Moderate cost, reduced in warm water | 5.9 kJ/g wet gain |
| Pacific salmon | 46-56°F / 8-13°C | High migration and spawning demand | 6.6 kJ/g wet gain |
| Prey or feed type | Typical wet energy | Assimilation hint | Calculator use |
|---|---|---|---|
| Shad / oily forage | 5.0-6.4 kJ/g | Good if swallowed whole | Predator gain checks |
| Minnows / lean fish | 4.2-5.4 kJ/g | Reliable mixed prey value | Bass, walleye, pike |
| Aquatic insects | 3.2-4.5 kJ/g | Useful during hatches | Trout and panfish windows |
| Crayfish | 3.7-4.7 kJ/g | Shell lowers usable fraction | Bass and river fish |
| High protein pellet | 5.8-7.2 kJ/g | High if actively consumed | Managed pond estimates |
| Condition modifier | Low setting | Middle setting | High setting |
|---|---|---|---|
| Activity load | Resting: x0.82 | Moderate: x1.25 | Burst: x1.85 |
| Oxygen stress | Excellent: +0% | Warm stress: +16% | Poor: +38% |
| Spawning allocation | None: 0% | Pre-spawn: 18% | Active: 42% |
| Digestion cost | Lean meal: 8-11% | Mixed prey: 12-15% | Large meal: 16-20% |
| Net energy result | Energy signal | Likely weight direction | Planning interpretation |
|---|---|---|---|
| Strong surplus | +25% or more of gross intake | Visible wet weight gain | Feeding more than covers costs |
| Small surplus | +5% to +25% of gross intake | Slow growth or recovery | Growth possible but fragile |
| Near maintenance | -5% to +5% of gross intake | Stable average weight | One stressor can erase gain |
| Energy deficit | Below -5% of gross intake | Weight or reserves decline | Costs exceed intake window |
💡Energy estimate tips
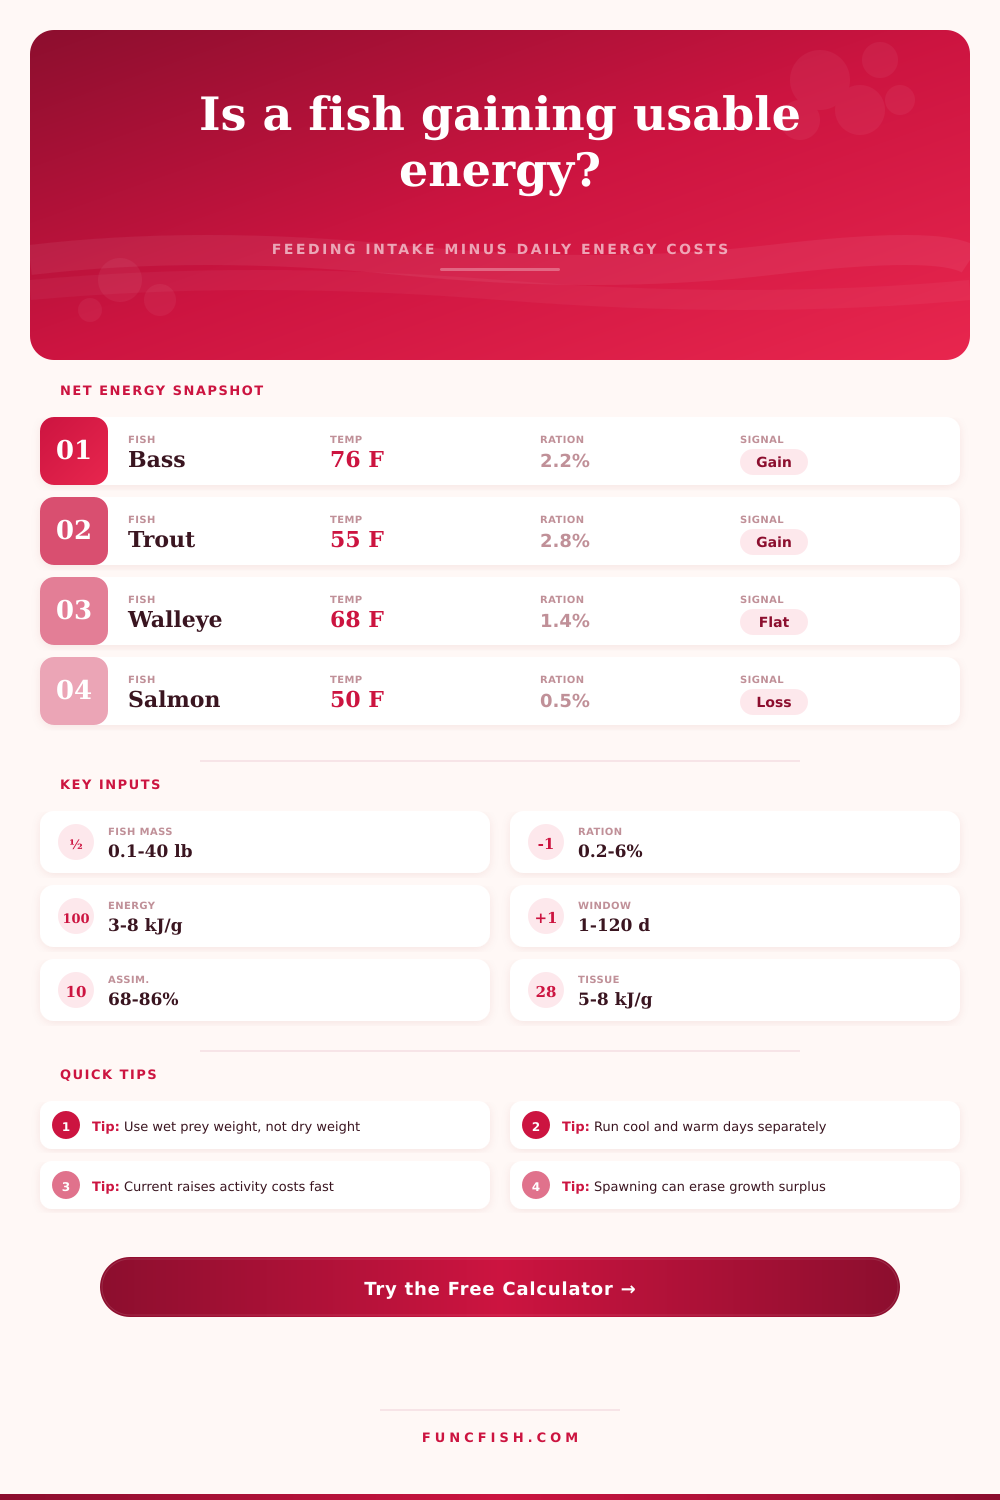
Tip: Keep the meal rate realistic for the temperature band. A high ration in cold water often overstates net gain because digestion and feeding frequency both slow.
Tip: If temperature, current, or oxygen changes during the period, run several shorter windows. Add the net kJ values before converting to possible body change.
Seeing a bass eat a shad in three seconds will lead you to believe it’s a healthy, thriving fish; but the financial ledger below that surface action might be a little more stingy. Bass are not passive storage units that gets filled up with biomass each time they open their mouth. They’re metabolic furnaces driven by effort, temperature and water. The truth of the matter is in the difference between what they eat versus what they realy retain. We (pond managers and most anglers) tend to look at the former instead of the latter and therefore miss the nuance.
The problem? Metabolism doesn’t come set at a specific number. It change based off the water’s oxygen levels, the water’s temperature and how much work it requires the fish to do to remain stationary. Holding a walleye in a fast current burns significantly more energy then keeping him still in a slack-water cove. That’s the so-called “hidden cost” this tool will account for when it does the math for you. It factors in the changing nature of digestion, the stress of oxygen depletion, and the huge amount of energy spent during spawning. If it didn’t, you would of been shooting in the dark.
The Hidden Cost of Fish Energy
Know the diet. In natural world, not all calories are made the same. Hard-shelled crustaceans (like crayfish) or lean minnows takes more effort to break down compared to the calories gained from them. A fatty shad offers a higher caloric bang per ounce. If 10% of the food ingested by a predator goes toward processing a difficult meal, it will never become new tissue. That’s lost energy. Diet and species determine assimilation efficiency, how much of each bite a creature converts into something new. Every animal is different, so you need to includes this. For example, an insect-eating trout processes a fraction of its meal differently than a catfish does when munching on a worm. The calculator account for these conversions without your having to remember biology coefficients.
And then we have that quiet assassin, the spawning factor. When fish are actively spawning and during the pre-spawn period, they will take huge percentages of their absorbed energy and puts it toward gonads instead of body development. A largemouth bass may appear healthy and full in April, but its net energy balance (net energy for gaining weight) could be very negative. It’s workin’, not growin’ as they say. This is why fish in some ponds stop growing even though they are still being fed. The energy go to reproduction, which is biologically wise but frustrating if you’re looking to increase biomass.
Everything else starts with water temperature. Metabolic rates slow in cooler water, so they need to eat less and won’t grow as fast on the food you give them. Feed ‘em too much in cooler water and it rots (uneaten) or the fish can’t handle all that extra food very well. On the flip side, warm water drives up metabolism. They has to eat more just to survive, much less grow. Combine this with a lack of oxygen in those warmer months and the stress multiplier gets dialed-in which raises the price of life even higher. You’re feeding them well but environment is costing them dearly.
Flat (The fish’s net energy balance is zero). This signal helps you decide whether to adjust ration sizes, improve aeration, or simply wait for better conditions. Loss, If there’s a deficiency of oxygen in the water column, it raises the fish’s cost of living; if there is a deficit, the fish will cannibalize its own reserves to survive. Gain is slow but steady when it shows a slight positive number. When it shows an impressive plus sign, it’s on a fast track to plumpness because the water parameters are perfect.
So in conclusion, changing how we think about net energy gain changes our focus from feeding to management. Sudden you’re viewing the water column less like a habitat and more like an energy landscape. It’s no longer simply who has the most food but who is in the least expensive place to live while still thriving. Remember the equation and you’ll begin reading the water far more clearly. Whether you look at the ledger or not, it always balances.