Fish Recruitment Rate Calculator
Estimate young-of-year recruits from spawning adults, fecundity, habitat, survey catchability, and effort so one year class can be compared with another.
📌Recruitment presets
⚙Spawner and recruit inputs
Recruitment estimate
Calculation breakdown
📊Survey method factors
Useful for shallow shoreline young-of-year checks.
Good for repeatable shoreline or stream stations.
Best when effort and net mouth area are consistent.
Strong for movement pulses, weaker for static density.
⚖Comparison grid
Total viable egg pool after adult sex ratio and spawning participation.
Young fish caught per survey effort unit before catchability expansion.
How closely survey-expanded recruits match the egg-survival model.
Expected surviving recruits after the selected post-survey mortality.
📘Reference tables
| Species profile | Typical eggs / female | Usual recruit stage | Good R/adult signal | Recruitment note |
|---|---|---|---|---|
| Largemouth bass | 2,000-25,000 | Age-0 shoreline | 5-20 | Nest success and fry cover drive year-class swings. |
| Bluegill | 10,000-60,000 | Fry to fingerling | 20-80 | Multiple spawning waves can inflate seasonal totals. |
| Walleye | 25,000-150,000 | Fall age-0 | 2-12 | Hatch survival and first-feeding conditions are critical. |
| Trout | 800-4,000 | Young-of-year | 1-8 | Redd survival, flow, and cover shape recruitment. |
| Striped bass | 500k-3M | Juvenile index | 0.5-5 | Large egg pools can still produce weak year classes. |
| Survey method | Best use | Detection range | Effort unit | Main bias |
|---|---|---|---|---|
| Seine haul | Shallow nursery YOY | 12-30% | Haul | Misses deep or vegetated fish |
| Backpack electrofishing | Stream recruits | 20-45% | Station | Reach depth and conductivity |
| Boat electrofishing | Shoreline age-0 | 18-35% | Station | Cover and visibility |
| Mini-fyke / trap net | Movement pulses | 5-20% | Net night | Behavior and season |
| Trawl or plankton tow | Open-water larvae | 6-18% | Tow minute | Patchy distribution |
| Year-class status | Index score | R/adult read | Density read | Interpretation |
|---|---|---|---|---|
| Failed | 0-20 | Under 1 | Trace | Spawner output did not convert into sampled young fish. |
| Weak | 21-45 | 1-4 | Low | Some recruits present, but year class needs follow-up. |
| Moderate | 46-70 | 5-14 | Usable | Recruitment appears adequate for normal replacement. |
| Strong | 71-88 | 15-30 | High | Year class should be visible in future size samples. |
| Pulse | 89-100 | 30+ | Very high | Watch for later density-dependent growth limits. |
| Water type | Recruitment driver | Habitat index clue | Repeatability | Comparison advice |
|---|---|---|---|---|
| Pond | Adult balance and cover | 60-100% | High | Compare after similar spawn timing. |
| Reservoir | Water level and coves | 45-95% | Moderate | Separate embayments when possible. |
| Stream | Flow stability and substrate | 50-90% | Moderate | Use the same reach length each year. |
| Wetland | Flood pulse duration | 30-120% | Variable | Record access to floodplain habitat. |
| Estuary | Salinity and nursery access | 40-110% | Variable | Pair index stations with salinity notes. |
💡Practical notes
In spite of a lake full of adult breeders, you can witness one year class dissapears. It happens every spring on some of the most productive waters in North America. It leaves anglers scratching they heads. They wonder why there is nothing there even though the fishery was assessed to have high numbers just months earlier.
Recruitment stops being an abstract biological term and becomes something very real. It determines if your favorite water body will offer good fishing for the upcoming season or force you to sit back and wait several years.
Why Some Fish Fail to Survive
Those first few weeks following hatch is typically where the difference is made between a pulse year class and a failed year class. Environmental conditions determines the fates of thousands of potential recruit, and survival rates are razor thin during this period of time.
Enter your survey info into the above tool and it spits out the complicated math for you. You won’t have to mess with adjusting catchability coefficients based off which type of gear you used (electrofishing versus seining).
So what are these numbers anyway? How do they translate to the field? Catchability is certainly one of more difficult variables to measure; you have different behavior in adults compared to juveniles. Larvae that is drifting in open water may not be caught at all using shoreline electrofishing, whereas an adult minnow school that’s tucked into some submerged brush would never be touched with a sweep net. You end up thinking you’ve got a poor year class when really you just underestimated how few fish your equipment could detect.
Habitat quality act as the bottleneck for everything else. Even if you get a million spawners and they make a million eggs, it won’t matter if there isn’t enough food and cover for fry during their first few days of life. Without those things the fry won’t survive. That’s why the habitat index is such an important part of the calculation model.
If your wetland floods and suddenly has all this new forage and cover in the nursery areas, that increases the index above 100 percent, while a clear water lake full of sterile bottom will pull it down near 60 percent. Before you even drop net into the water, the environment has put a ceiling on recruitment.
When making comparisons between years, it’s important to be as consistent as possible. For instance, don’t compare a seine haul from June to an electrofishing station catch in August because age zero fish grow fast and shift habitats every week of the summer. To make meaningful comparison you want to sample the exact same area at the exact same life stage each year to determine whether the trend is going up or down.
With this calculator, you can account for detection probability and effort units and get a standardized metric which when placed next to historical data from other seasons realy does mean something. Be careful with getting too bogged in trying to be perfectly precise with each input. Fish change, water clarity changes from day-to-day and field conditions aren’t always neat and tidy. What you want is an indicator of relative strength rather than counting all the organisms.
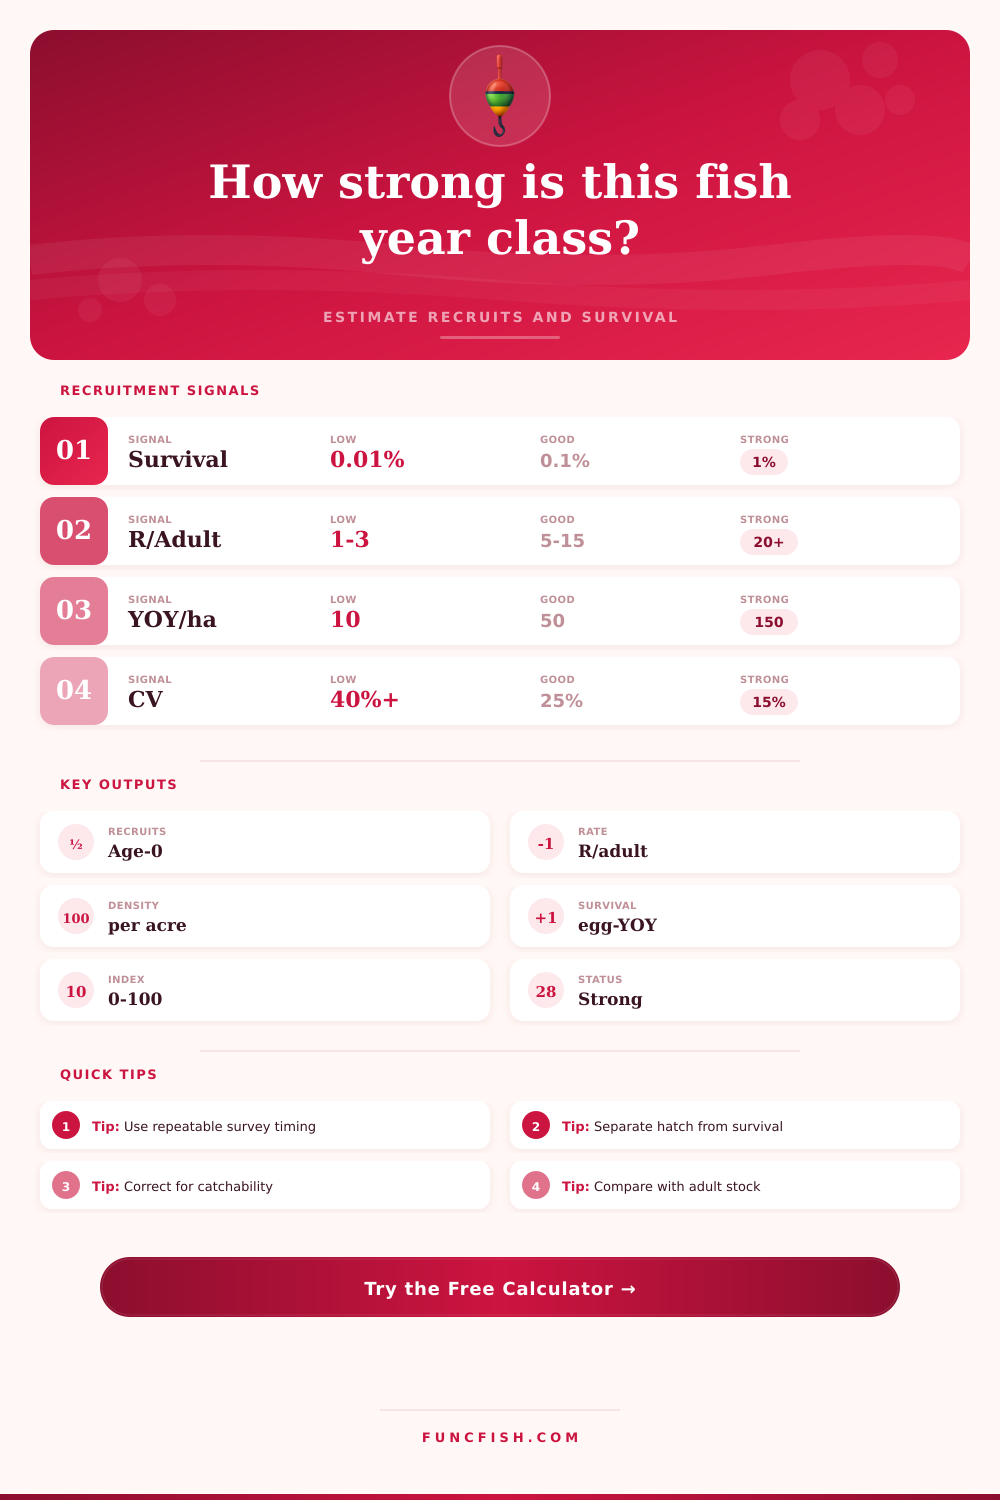
As long as your recruits per adult (after adjusting) exceeds fifteen for back to back years, you’ve got a good year class coming into the system despite small variances in your estimate of reproduction. That’s where folks miss it. They’re chasing specific numbers. Instead, they should of look at the trend line to see if it stays steady enough to show the population is reacting to the environment or management action properly.
To conclude. Recruitment monitoring ultimately connects the dots between spawning success and future harvestable amounts. It helps anglers change their tactics based on more than just personal stories. It also helps managers fine tune their stocking plans based on data driven decisions.
Separate out hatch survival from post survey mortality so you know exactly where your losses is happening. Don’t guess blindly at what went wrong but go right for addressing those specific issues. As long as somebody pays attention below the surface, the cycle will continue. We want to make sure the next generation has a fighting chance of replacing the ones we put on the table today.