Fish Swim Speed by Body Length Calculator
Convert body lengths per second into water-relative speed, ground speed against current, distance covered, and endurance notes for common sport fish and survey scenarios.
📌Swim speed presets
⚙Speed inputs
Swim speed results
Calculation breakdown
📊Species speed profile grid
Routine swimming, position changes, and low-effort travel.
Foraging, holding in moderate flow, or short chases.
High effort movement that usually lasts seconds to minutes.
Escape, strike, or panic speed with rapid fatigue.
🧭Comparison grid
Scales speed to fish size, so a small trout and large tarpon can be compared cleanly.
Use ground speed when timing fish against fixed rocks, docks, pilings, or video marks.
Use water-relative speed for swim tunnel, aquaculture, passage, and endurance checks.
High BL/s numbers are plausible for strikes, but distance should stay short.
📘Reference tables
| Species profile | Typical length | Cruise BL/s | Sprint BL/s | Use note |
|---|---|---|---|---|
| Largemouth bass | 12-20 in / 30-51 cm | 0.8-1.8 | 3-6 | Short ambush moves, cover edges, moderate sustained ability. |
| Rainbow trout | 10-20 in / 25-51 cm | 0.8-2.0 | 4-7 | Often holds position against current before short upstream moves. |
| Chinook salmon | 24-42 in / 61-107 cm | 1.0-2.4 | 4-7 | Migration speeds depend heavily on flow and fatigue state. |
| Bluefin tuna | 48-96 in / 122-244 cm | 1.0-2.5 | 5-9 | Large pelagic fish can cover high absolute speed at modest BL/s. |
| Northern pike | 24-42 in / 61-107 cm | 0.6-1.4 | 5-10 | Built for fast acceleration and short ambush bursts. |
| Common carp | 18-32 in / 46-81 cm | 0.5-1.2 | 2.5-5 | Efficient sustained cruising, lower peak burst than many predators. |
| Swimming mode | Typical BL/s | Duration signal | Interpretation | Calculator use |
|---|---|---|---|---|
| Station holding | 0.2-0.8 | Long | Fish offsets current with minimal forward progress. | Good for current and fishway checks. |
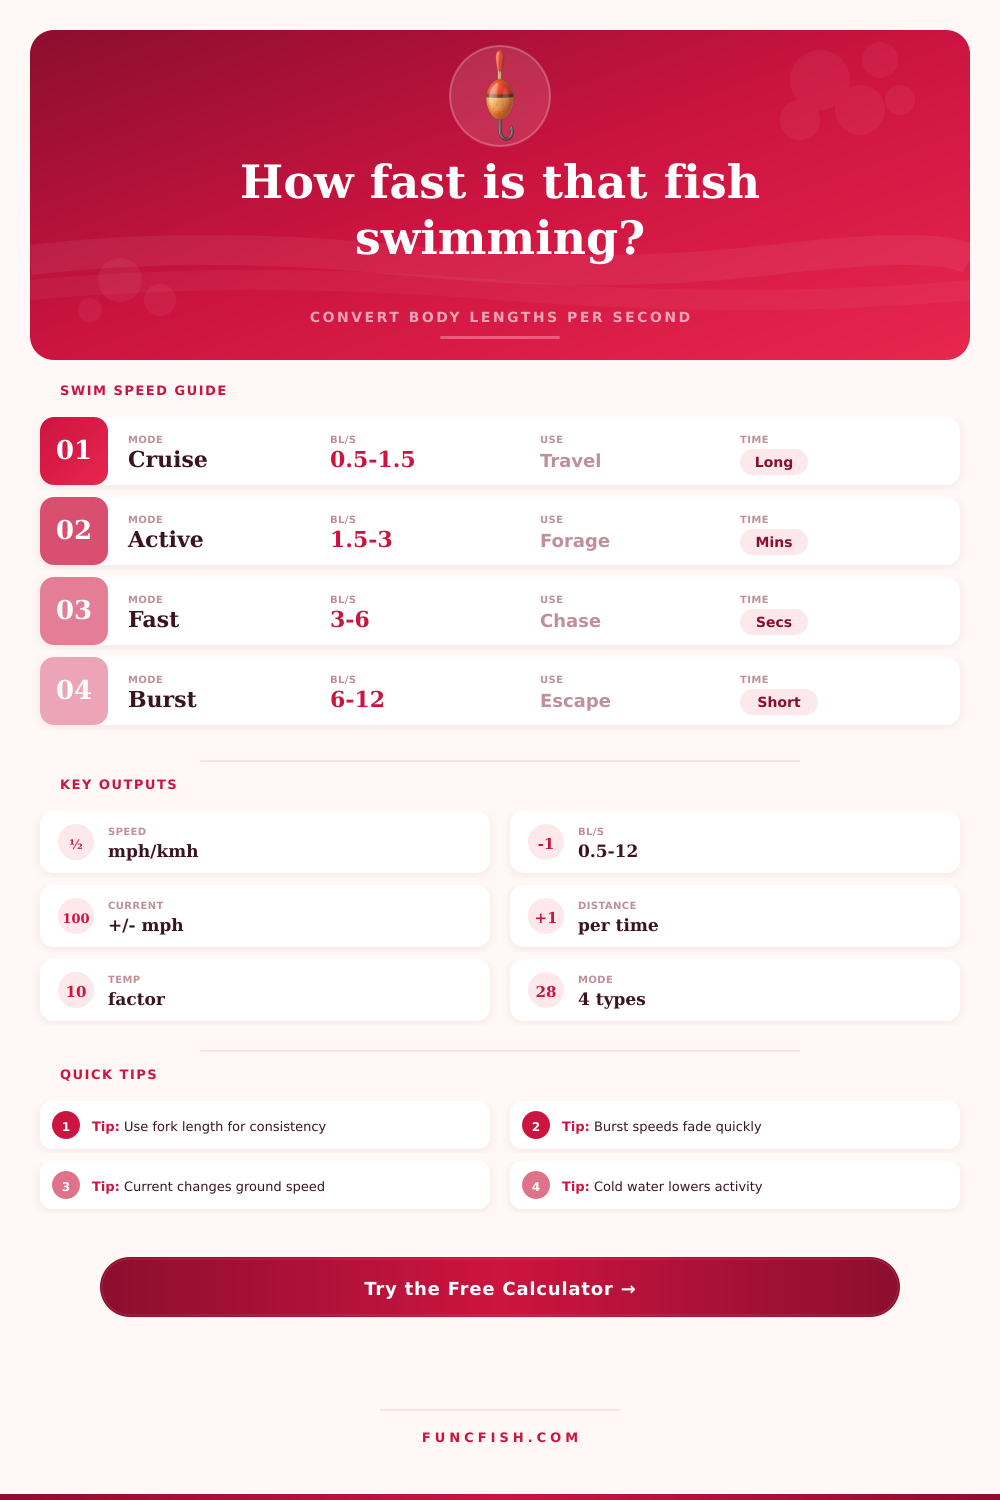
| Cruise / routine | 0.5-1.5 | Long | Normal travel, searching, schooling, or patrol speed. | Use for ordinary movement estimates. |
| Active chase | 1.5-3.0 | Minutes | Foraging, active holding, lure follow, or migration push. | Good default for active fish. |
| Fast sprint | 3.0-6.0 | Seconds | High effort acceleration before fatigue becomes important. | Use for short pursuit distance. |
| Escape burst | 6.0-12.0 | Very short | Maximum effort escape or strike with rapid fatigue. | Use only for brief bursts. |
| Temperature zone | Warmwater fish | Coldwater fish | Activity factor | Practical note |
|---|---|---|---|---|
| Cold stress | Under 50 F / 10 C | Under 38 F / 3 C | 0.70-0.85 | Activity and acceleration often drop unless species is cold adapted. |
| Cool active | 50-62 F / 10-17 C | 38-52 F / 3-11 C | 0.90-1.00 | Good sustained activity for many trout, salmon, and walleye. |
| Optimum | 62-78 F / 17-26 C | 52-62 F / 11-17 C | 1.00-1.08 | Typical peak activity zone for the selected profile. |
| Warm stress | Over 84 F / 29 C | Over 68 F / 20 C | 0.75-0.90 | High temperature can reduce endurance even when burst speed is possible. |
| Current situation | Ground speed formula | Best interpretation | Common use | Watch-out |
|---|---|---|---|---|
| Still water | Swim speed | Water and ground speed match. | Ponds, lakes, tanks, calm bays. | Wind drift may still move surface water. |
| Upstream | Swim - current | Forward progress can be low or negative. | Trout holding, salmon passage, river fish. | Use water-relative speed for fish effort. |
| Downstream | Swim + current | Ground speed may look much faster. | Drifting fish, bait movement, tidal passes. | Do not confuse drift with swimming effort. |
| Crosscurrent | Vector estimate | Bank progress is partly sideways. | Crossing channels, inlet seams, bridge pilings. | Actual path is longer than bank progress. |
💡Calculation tips
A big bass hovers around piece of timber. It’s moving slow, looking all deceptive when suddenly it accelerate explosively out of sight, gone in the blink of an eye. Anglers refer to that as burst speed.
It is difficult to guess a fish’s actualy speed because miles per hour don’t account for one key variable. For example, a two pound bass and a 50 pound tarpon could each be cruising at similar effort relative to their size, but their absolute speeds would be wildly different then. This makes the measure of swim speed in terms of body lengths per second far better than anything else. The number scale the effort down to the animal and lets you compare the small trout tucking into a creek with a huge tuna running offshore on equal footing.
How to Measure Fish Speed
This page let you take those measurements of body length and turn it into usable distances and speeds. All you do is pick your species, enter their fork length, choose swimming mode and the calculator does the rest. It turns biological effort into miles per hour (or kilometers per hour). And it factors in current.
That’s where folks go wrong. When there’s a current, the speed through the water is not the same as the speed over the ground. A 2 mile per hour fish headed up-current with a two mile per hour current has zero ground speed. It’s burning energy to maintain position. And that’s what folks screw up doing when trying to time how long it takes a fish to pass a fixed landmark.
These figures also take water temperature into consideration, big time. Metabolic rates of warmwater species (i.e., catfish, bass) slows down in cold water, which decreases both their endurance and rate of acceleration. This thermal stress is automatically taken into account by the calculator. In other words, if it’s late fall or early spring, your output will be reflective of such lethargy. Warm water, on the other hand, can increase activity to a certain extent before oxygen becomes a limiting factor.
Knowing this allow you to set realistic expectations regarding lure speed. You’re not likely to get many bites casting a crankbait at full burn when it’s forty degrees out; the fish simply won’t be able to keep up with it.
It’s not just about which species; it’s also about swimming modes. An escape burst lasts only seconds… Perhaps three or four, until the lactic acid accumulates and performance fail. A cruise might sustain itself for hours. If it’s a topwater lure, do you know if the bass is sprinting out to attack (sprint mode) or chasing in active mode? That’s where most strikes occurs: in those initial several body lengths of the pursuit. Anything beyond that and the fish is probably fatigued more than anything else. It’s not losing interest, but instead giving up because it can no longer muster the effort. The tool separates this level of effort so you can connect distance with intensity.
It gets even more complicated when current is factored in. A swimming fish seems to be moving across the bottom faster than it actualy is if the current is moving it downstream. From an observer on the bank a swimming fish will seem to be moving slower than what it can do if current is taking it upstream. The calculator provide two measurements: ground speed and water relative speed. It tells you not only how much energy the fish is using but also exactly how fast it’s progressing. That’s important whether you’re trying to analyze video of migrating fish in rivers or design fishways.
To get something meaningful out of it, consistency matters when it comes to measurements. For most cases, total length isn’t as good as fork length, since the tail fins is often shaped differently and may not be in prime condition on any given fish. You’ll also have more apples-to-apples comparisons whether you’re comparing your own catch or observation or looking at someone else’s. And having a baseline idea of what to expect is a starting point if you’re unfamiliar with the cruising speeds of certain species (the reference tables that come with this tool offers the usual range for popular sport fish). You should of checked these first.
But more importantly, these numbers help bridge the gap between observation and understanding. When you see a fast moving school of shad do you think it’s feeding, or do you think it’s running away? With some context, you know enough to make an educated guess. And as always, reading the behavior and watching the water is essential. But now, you have a decent idea of how hard that fish is working and it paints a clearer picture of what’s going on under the surface.