Fish Tail Beat Frequency Calculator
Estimate tail beats per second from swim speed, fish length, tail amplitude, temperature, and body form, then compare the result against practical swimming effort bands.
🎣 Tail beat presets
⚙ Fish motion inputs
Tail beat frequency estimate
Calculation breakdown
📊 Motion summary grid
Seconds for one complete left-right-left tail cycle.
Forward travel during each complete tail cycle.
Higher values make manual video counting easier.
Cadence from the count and observation window.
🧪 Effort comparison grid
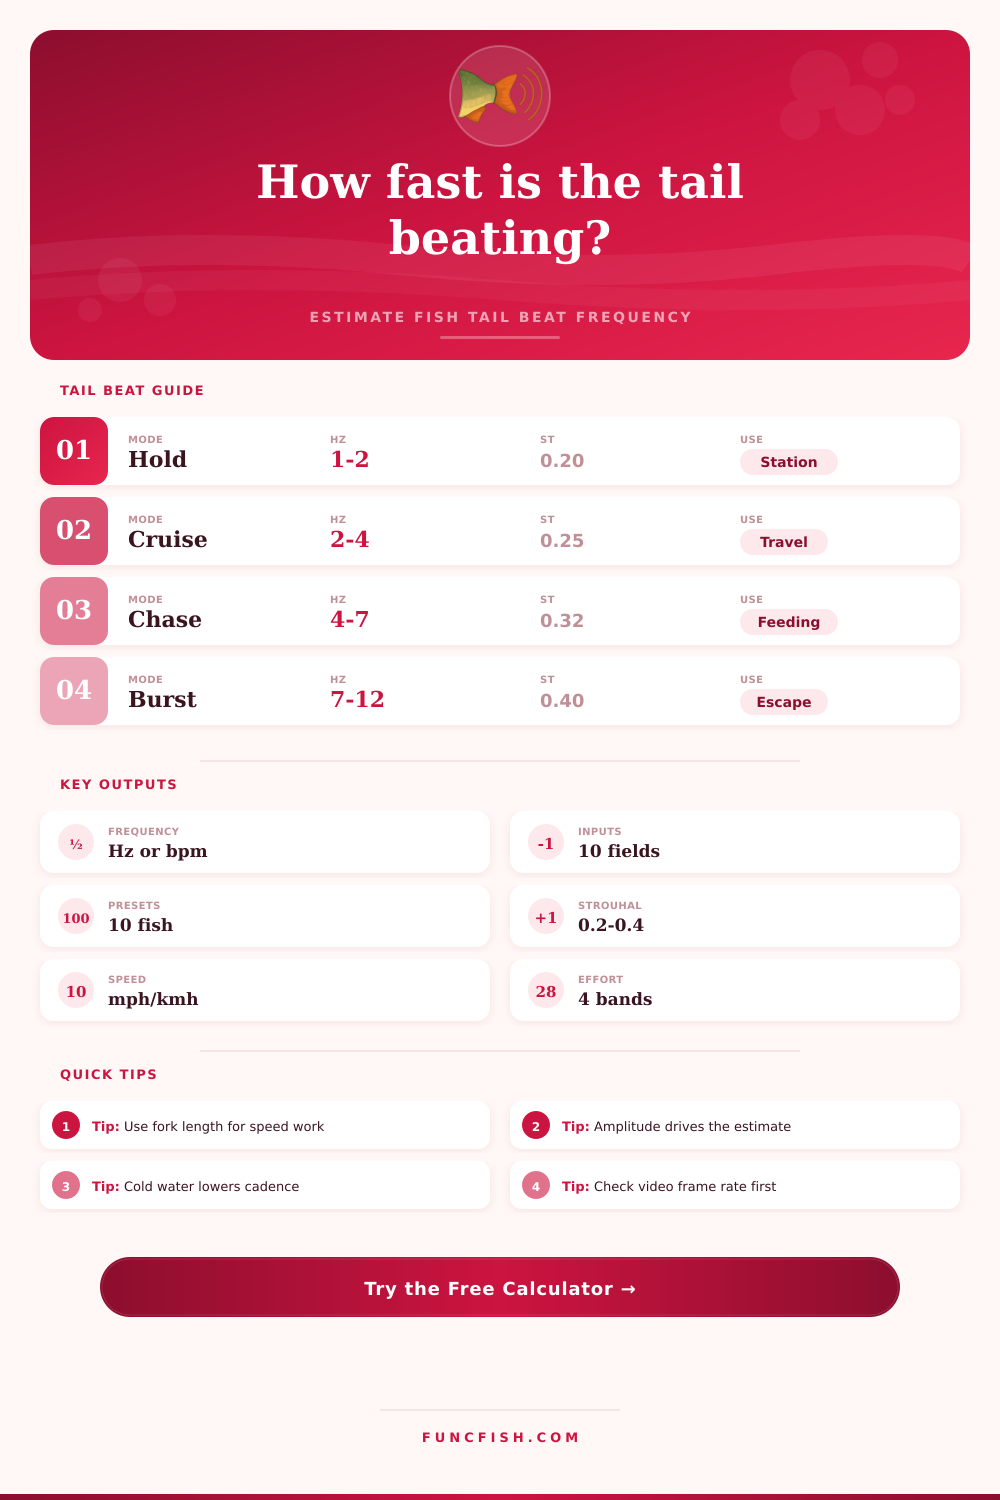
Station holding
Low cadence used for position control in current or tank flow.
Cruise swim
Efficient routine locomotion where Strouhal number often clusters near 0.25 to 0.35.
Active chase
Shorter feeding or positioning effort with higher tail rate and drag.
Burst escape
Very high cadence that fades quickly and can be hard to count on slow video.
📘 Tail beat reference tables
| Species group | Typical length used | Tail amplitude guide | Target Strouhal | Notes for calculator |
|---|---|---|---|---|
| Bass / sunfish | 10-20 in / 25-51 cm | 14-22% of length | 0.28-0.36 | Moderate body depth and strong acceleration. |
| Trout / salmonid | 8-30 in / 20-76 cm | 12-20% of length | 0.24-0.32 | Streamlined shape suits current and passage checks. |
| Pike / muskie | 18-44 in / 46-112 cm | 10-18% of length | 0.26-0.34 | Long body means lower cadence for the same speed. |
| Carp / buffalo | 14-36 in / 36-91 cm | 16-25% of length | 0.30-0.40 | Deep body and slower cruising cadence. |
| Tuna / mackerel | 16-60 in / 41-152 cm | 7-14% of length | 0.20-0.30 | Stiff body, narrow caudal beat, high sustained speed. |
| Swimming mode | Body lengths per second | Tail beat frequency cue | Endurance window | Common use |
|---|---|---|---|---|
| Holding | 0.3-1.0 BL/s | Slow, regular beat | Minutes to hours | Current station, tank flow, light positioning. |
| Cruise | 1.0-2.5 BL/s | Steady rhythm | Minutes | Routine travel and forage movement. |
| Active chase | 2.5-5.0 BL/s | Fast but countable | Seconds to minutes | Feeding chase, lure follow, passage push. |
| Burst | 5.0-10.0 BL/s | Hard to count | One to several seconds | Escape, strike, startle, rapid acceleration. |
| Video frame rate | Useful frequency range | Frames per beat at 4 Hz | Counting quality | Practical note |
|---|---|---|---|---|
| 30 fps | 0.5-5 Hz | 7.5 | Fair | Good for cruise, weak for quick burst counting. |
| 60 fps | 0.5-9 Hz | 15 | Good | Works for most sport fish tail beat checks. |
| 120 fps | 1-16 Hz | 30 | Strong | Best for panfish startles and short strikes. |
| 240 fps | 2-30 Hz | 60 | Excellent | Useful when burst beats blur in normal video. |
| Strouhal band | Interpretation | Likely cause | Calculator action | Field check |
|---|---|---|---|---|
| Below 0.20 | Low amplitude or high speed | Tail swing undercounted | Recheck amplitude | Look for body bend outside the tail tip. |
| 0.20-0.40 | Efficient undulatory range | Typical cruise or chase | Use as primary estimate | Compare with observed beats from video. |
| 0.40-0.55 | High effort or high drag | Deep body, burst, stress | Review condition | Check for turning, acceleration, or current error. |
| Above 0.55 | Questionable for steady swim | Speed or amplitude mismatch | Measure again | Use slow-motion footage if possible. |
✅ Tail beat tips
If you watch a fish swimming, you might just see a blur of water and silver. But there’s a rhythm underneath which most people fail to notice. That rhythm is the tail beat, engine propelling it forward. It is a precise mechanical cycle. It influences not only how efficiently a fish moves in its environment, but also your approach to aquarium care, biological research, or angling. Knowing the frequency alter what you see: no longer do you see the fish, you read its physiology. Did it burn reserves for an unexpected lunge? Or does it conserve energy for migration?
By entering some simple motion parameters into calculator above, it does the math for you. You don’t need to try to remember a set of fluid dynamics equations that few of us ever memorized. It’s an estimate based off three physical parameters; length, amplitude, and speed. The speed is easy enough, provided you’ve got some kind of reference point in water.
How Fish Move in Water
And length? Larger fish tend to swim slower then their smaller relatives while still covering the same distance with each stroke. Because of this, they move at a lower relative frequency. This equals about the same body-length-per-second as smaller fish. Then comes the kicker, amplitude. Amplitude is not the bodys overall curvature; instead, it is how much the tail tips swings from side to side. Get this wrong. Measuring the back bend when trying to estimate actual fin sweep; and your estimated Strouhal number will be way off.
For most effective swimmers, that number is between 0.2 and 0.4. Think of it as a dimensionless ratio comparing the fish’s ability to overcome drag versus its ability to glide efficienty. That’s where water temperature enters into math, as the faster muscles contracts due to heat energy. Even at the same current strength, a trout will beat its tail slower in 6-degree water than it would in 68-degree water while maintaining a body posture. This is why we need both physical dimensions and some form of environmental variable to get good models. You can see the tool takes your water temp and adjusts the likely ceiling of cadence accordingly. It won’t let you expect a slow-moving wintertime fish to act like summer predator.
Here’s where video analysis gets tricky, especially with frame rate. If you try to count beats from video shot at 30 frames per second, you’ll miss half of the tail flicks in a burst escape sequence. The action will look smooth in person but jerky on film. At higher frame rates like 120 or 240 you can get the resolution that pick up quick acceleration without blurring it. You want to be able to pick out each beat so clearly that you know when one cycle ends and another begins. Guessing a rhythm you can’t see doesn’t counts.
Watching fish in current makes correction a factor as well. Even if a fish holds still in a river and his ground speed is zero with respect to the bank, he’s working hard. He beats his tail fast enough to stay put, burning up oxygen but not really going anywhere. Drifting downstream greatly relieves that work. That’s what the calculator does, let you indicate whether you’re watching their speed in relation to land reference points or whether it takes water movement into account. Being lazy while floating along isn’t the same as actively trying to hold your spot. That distinction matter when you want to understand how they spend their energy out there in nature.
Outliers in Strouhal number (outside of this efficient band) typically represent odd swim modes or stressed states. If numbers drop to less than 0.2, the fish is either swimming very fast, and therefore has little tail swing, or is swimming so efficiently that it appears very streamlined. Numbers above 0.45 typically represent frantic escape behavior or some other high drag condition. These are not mistakes but rather data points indicative of an accelerating fish or one under pressure. Knowing these bands can help you understand what might cause a fish to appear erratic or tired without having to take invasive samples.
You should of known this sooner. The idea of measuring tail beats seems academic until you use it in practical situations, such as tank flow control or lure choice. By setting the current speed of a filter to hold frequencies matching those of your target species, you prevent them exhausting themselves every day against an unnatural flow rate. Or by setting your pull speed to the natural cruising frequency of whatever you are targeting, you will make the prey appear to be mechanically correct, triggering instinctive strikes.
It converts hazy intuition into measurable information. Water becomes not simply empty space but a medium with identifiable sets of mechanical rules. If you know what to listen for, tail’s beat is steady and telling.