Fish Tail Fork Ratio Calculator
Convert between total length and fork length, estimate tail extension, flag unusual ratios, and compare measurements against common fork-tailed fish profiles.
📌Length conversion presets
⚙Tail and fork inputs
Tail fork ratio results
Calculation breakdown
📊Species ratio data grid
Deep lunate tail; fork length is common in offshore logs.
Long fork offset; measure straight on a flat board.
Moderate fork; useful for hatchery and creel records.
Shallow fork; total length is usually the control measure.
🧭Measurement comparison grid
Snout to tail fork. Best for tuna, jacks, salmonids, and fork-tailed survey records.
Snout to longest tail tip. Often required for slot checks and harvest records.
The length beyond the fork. Large values are normal on deeply forked tails.
Compares your fish to expected species range and board precision limits.
📘Reference tables
| Species / profile | Typical FL/TL | Expected range | Tail profile | Best use |
|---|---|---|---|---|
| Yellowfin tuna | 0.895 | 0.875 to 0.915 | Deep lunate fork | Offshore fork records |
| Mahi-mahi | 0.905 | 0.885 to 0.930 | Deep fork | Deck card conversions |
| Greater amberjack | 0.912 | 0.890 to 0.935 | Deep fork | Fork-only logbooks |
| Atlantic salmon | 0.943 | 0.925 to 0.960 | Moderate fork | Creel and hatchery records |
| Rainbow trout | 0.952 | 0.935 to 0.970 | Moderate fork | Stocking and survey checks |
| Striped bass | 0.965 | 0.948 to 0.982 | Shallow fork | Slot estimate cross-checks |
| Red snapper | 0.956 | 0.935 to 0.975 | Emarginate fork | Deck board comparisons |
| Walleye | 0.968 | 0.950 to 0.985 | Slight fork | Survey board QA |
| Ratio band | Meaning | Likely fish shape | Conversion caution |
|---|---|---|---|
| 0.875 to 0.915 | Large fork offset | Tuna, mahi, jacks | Do not substitute TL without conversion |
| 0.916 to 0.945 | Moderate fork offset | Salmon, mackerel, pelagic mixed | Check tail pinch method |
| 0.946 to 0.970 | Small fork offset | Trout, snapper, bass-like forms | Board precision matters |
| 0.971 to 0.990 | Very shallow fork | Walleye, perch-like forms | Fork depth may be hard to read |
| Below 0.875 | Unusually deep offset | Possible species mismatch | Recheck fork point and tail tip |
| Above 0.990 | Fork near total length | Rounded or damaged tail | Use total length if required |
| Measurement method | Primary length | Best precision | Risk to ratio | Field note |
|---|---|---|---|---|
| Flat measuring board | TL and FL | 1/8 in or 0.1 cm | Low | Keep snout square to the stop. |
| Tournament bump board | Total length | 1/4 in or 0.5 cm | Medium | Know whether pinched tail is allowed. |
| Deck tape | Total length | 1/2 in or 1 cm | Medium-high | A curved body can inflate length. |
| Lab calipers | FL, TL, SL | 0.1 mm to 1 mm | Low | Best for conversion coefficients. |
| Photo scale | Estimated TL | Variable | High | Use as a quick check only. |
| Scenario | Recommended input | Output to record | Why it matters |
|---|---|---|---|
| Fork-only offshore log | Fork length plus species | Estimated TL and offset | Converts logbook data to total-length comparisons. |
| Slot check cross-reference | Total length plus species | Estimated FL and QA flag | Shows how far the fork measure sits below TL. |
| Survey board audit | Both FL and TL | Measured ratio | Flags inconsistent field measurements. |
| Damaged tail note | FL, tail condition, precision | Confidence range | Records why conversion uncertainty is higher. |
| Batch average | Sample count and ratio | Batch confidence | Higher counts make species conversion more stable. |
💡Measurement tips
The dock’s been holding a huge yellowfin tuna, and you’ve just brought her aboard, your heart pounding with adrenaline because that fish need to be in water this very second. You reach for the measuring board, but then you remember. With every giant catch comes this problem: that forked, long-tailed creature wants to curl up when laid flat.
Do you go all-the-way around to Total Length, or only through the center-of-fork Notch? That choice determine your data, and a mistake will skew every logbook entry for years to come. Don’t guess at how your measurement method affect those numbers. Plug in your length and species into the calculator above; it’ll do math for you.
Why Fish Lengths Are Different
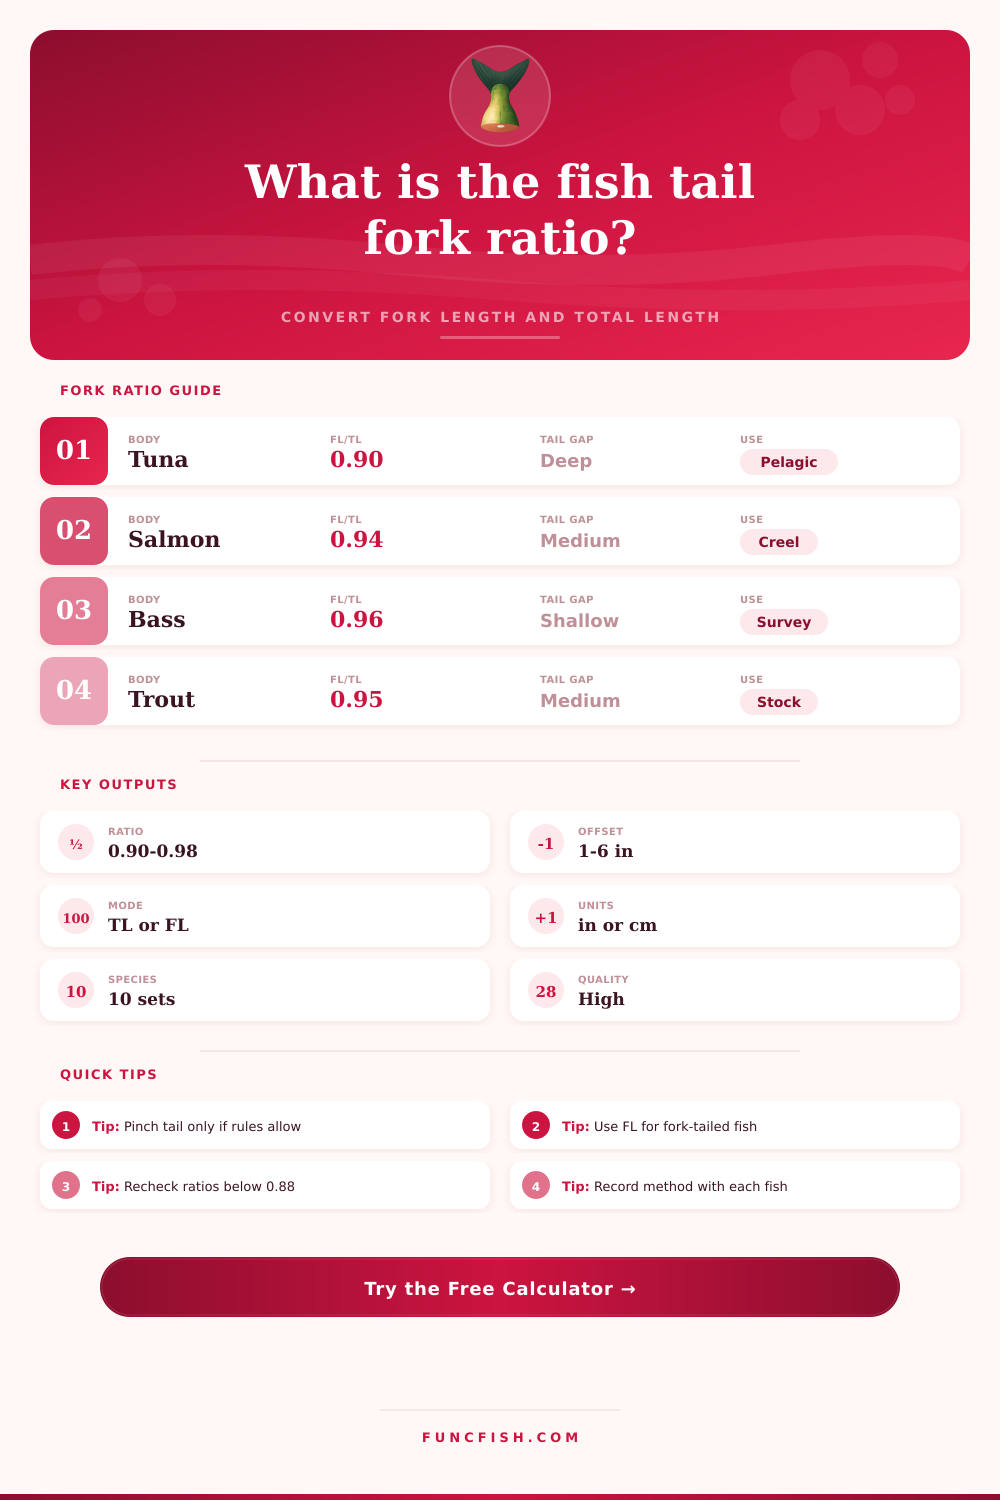
Measuring to the fork isn’t about word choice; it’s a physical truth regarding construction of growing fish. Speed is what forked tails do; they’re evolutionary engines. They also divide water efficiently by extending an inch or more out back without necessarily packing any extra muscle mass in the same area. So when you measure to the tip, you’re including that hydrodynamic wedge. But when you measure to the fork, you’re measuring the trunk of the fish; the main body. And the relationship between those two point tells a story. If the ratio is lower (like tuna at 0.90), then you have a tail with more depth and ten percent of what you measured was simply tail extension, whereas a bass are closer to 0.96.
Knowing this allows you to adjust the information whether you’re comparing different species or even same species at different times. For those who fish much, measurement becomes a one number deal: pull out the board, measure something, note the length and move on. But scientificly speaking, we should of know why we’re measuring something and precisely what we’ve measured to ensure consistency across time. You can’t just switch measurements from one number to another without converting them.
For instance, maybe your local tournament require pinched tail total lengths, while the creel survey require fork length. How do you convert? This tool fills that gap by using known species coefficients to estimate how long the fish would of been if you had caught it in a perfect position. Is it a pelagic runner with a deep fork or a shallow tailed coastal predator? It considers all of that and give you an idea of what the other measurement might be. That’s critical when comparing your catch to a historical average or growth chart that was perhaps made in a differant way.
Then there is human influence on the equation with board placement and tail condition. An inch or two of total length can be lost off the end due to a frayed tail tip, while a narrow dock board with a curled tail artificialy inflates its length. This kind of physical reality skews the ratio so much that the calculator’s tolerances won’t cleanly convert it. The system flag lower confidence in the output if you’re measuring a fish with damaged fins, as biology doesn’t always act like geometry.
So write down the number and the method used. It makes a difference down the road when understanding the meaning of slot limits and other metrics to measure stock health. Was that 32 inches from a relaxed tail or was it pinched? Standardizing how you do things eliminates your own bias and the shared bias within your community’s data set. Totaling fish for bass and measuring them for forks on tuna is going to throw some noise in your results. By having the reference table on the page it spells it all out with expected ranges for common gamefish so you can use those as a sanity check on what you see in the field. If you calculate a ratio way off than the norm, stop and check yourself again. Realize that consistency beats precision when you’re talking about hundreds of fish over a season.
In the end, fishing is about both data and memory. We like to recall our big fish stories, the ones that got away or the trophy we took home. Length records give us accurate information to build those memories on and to use for comparison later. Getting good data doesn’t require a lab. It only requires respecting the geometry of your catch. Measure carefuly. Note how you did it. Use the conversion tools if the standards change.
The last variable in the equation to separate an estimate from a useful record is the tail shape, which as it turns out is far more important than most folks believe. Get the fork right and the rest falls into place.