Hookup to Landing Ratio Calculator
Turn a trip log into a clean landing ratio, compare it with a realistic setup benchmark, and see which loss phase deserves attention first.
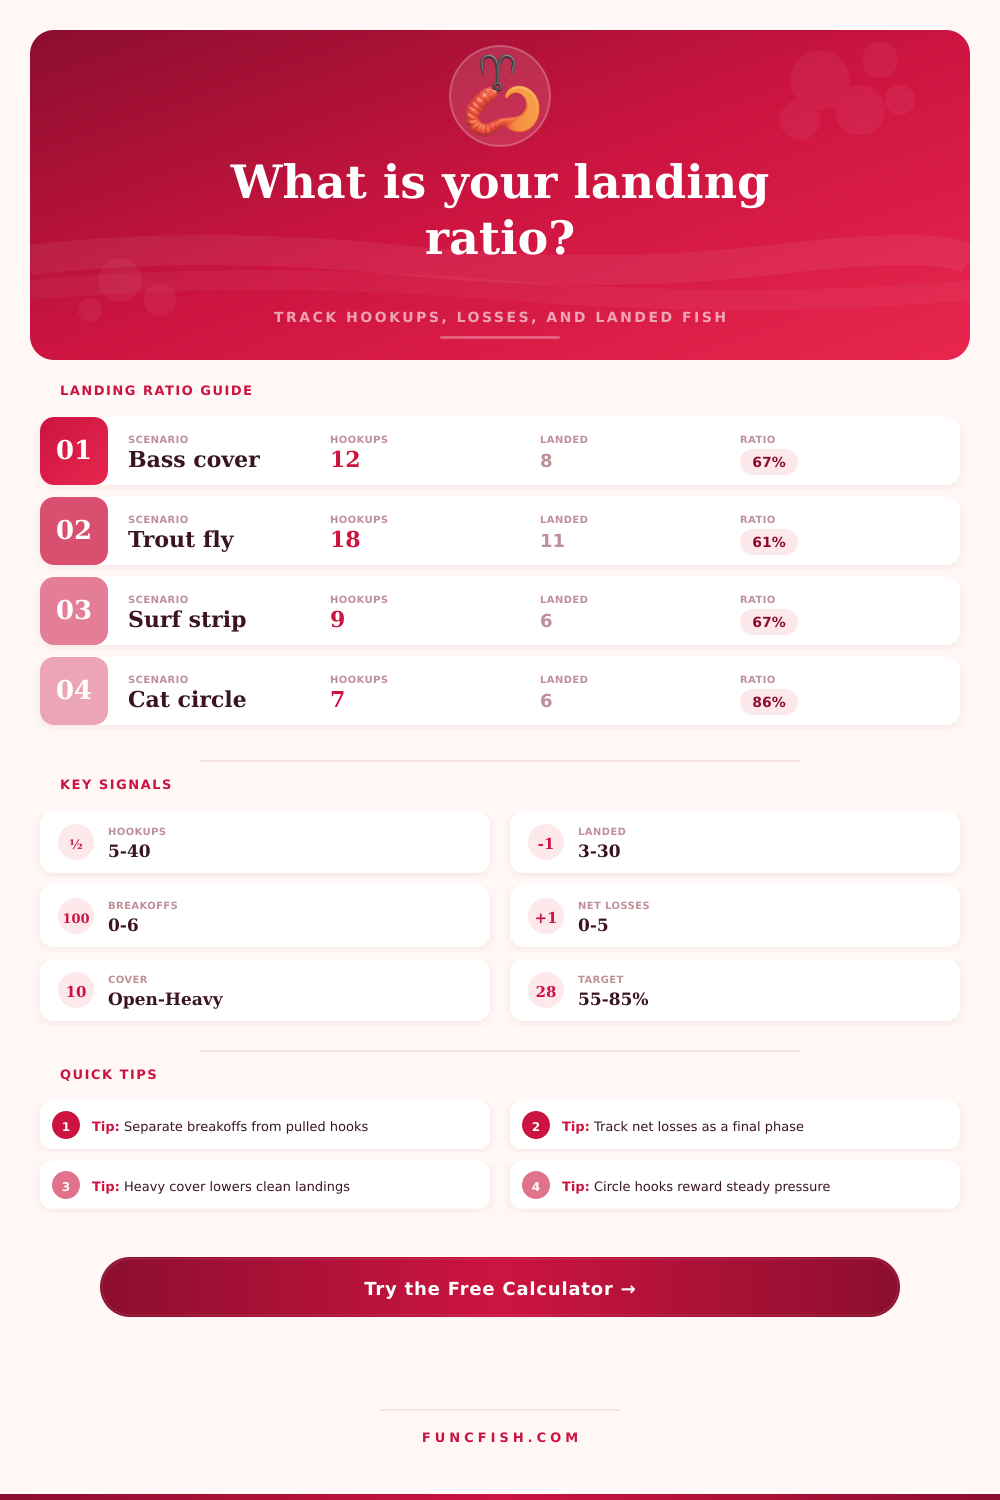
📌Scenario presets
⚙Trip log and setup
Landing ratio analysis
Full breakdown
📋Landing factor reference grid
Open Water
Heavy Cover
Circle Hook
Barbless
📊Reference tables
| Species group | Usual landing ratio | Main loss driver | Useful setup note |
|---|---|---|---|
| Panfish | 70-88% | Pulled hooks | Light wire, soft drag |
| Trout | 55-78% | Jumps and slack | Keep rod loaded |
| Walleye | 62-82% | Soft bites | Sharp hook points |
| Bass | 58-78% | Cover and jumps | Match line to cover |
| Catfish | 72-90% | Bad hook set | Circle hooks score well |
| Pike | 50-72% | Cutoffs | Use bite protection |
| Striped bass | 58-80% | Surf wash | Control the final yards |
| Offshore pelagic | 45-70% | Long fight fatigue | Use smooth drag pressure |
| Loss pattern | Common signal | Likely adjustment | Calculator weight |
|---|---|---|---|
| Pulled hooks | Fish gone mid-fight | Hook point, drag, rod angle | Hook pressure |
| Breakoffs | Line parts under load | Line test, leader, cover angle | Line reserve |
| Net losses | Fish lost in final reach | Net size, partner timing, drag | Landing aid |
| Missed strikes | Bites do not pin up | Hook gap, bait size, timing | Strike conversion |
💡Practical checks
Tip: Count only fish that were clearly pinned as hookups. Short taps and missed bites belong in the strikes field so the landing ratio stays honest.
Tip: Separate pulled hooks, breakoffs, and net losses. One combined lost-fish number hides whether the weak link is hook hold, line reserve, or landing handling.
The successes that you will experience while fishing will depend upon the number of fish that you land compared to the number of fish that bite your hook. Many peoples find themself with a gap between the number of fish that bite there hook and the number of fish that is actualy landed. This gap can exist for a variety of reasons that cause the fish to be lost.
Beyond losing the fish as a result of bad luck, people can lose their fish if their fishing gear doesnt match the environment in which the fish lives. By calculating the gap between the number of fish that bite the hook and the number of fish that are landed, anglers can determine the specific reason for their lost fish, and make necessary changes to their fishing method. The calculator that is included on this page will use the numbers that you have recorded to calculate your fishing success rate.
How to Stop Losing Fish
The numbers that you must enter include the number of hookups, the number of landed fish, the number of pulled fishing hooks, the number of breakoffs, and the number of fish that are lost at the net. The calculator will then compare these entered numbers to a benchmark success rate for your particular species of fish and fishing setup. This benchmark is based upon average ratios of the various factors that can impact your success while fishing.
If your catch rate is lower then the benchmark rate, the calculator will tell you during which phase of your fishing setup you are losing your fish. The type of fishing line that is used can have a significant impact upon whether the fish that bite your hook remain on the hook. Monofilament lines are often thought to provide a cushion that helps to keep the fish on the hook during strong run of the fish.
The downside of monofilament lines is that they stretch when in the presence of heavy cover, which can allow the fish to escape your hook. Braided lines with a short leader allow for the transfer of movements to the hook, but the fish repeatedly rub against a sharp structure and can damage the braid. These factors are included in the calculation of the benchmark for success while fishing.
The type of hook that is used can lead to different results while fishing. Circle hooks are beneficial when applying pressure to the fish to encourage the fish to land; they tend to convert more hookups into landed fish when using bait. Circle hooks, however, can fail when the fish move in a way that pulls the hook out of the mouth of the fish before the line becomes tight.
Barbless hooks allow for fish to be released without causing damage to the fish, but require the angler to maintain constant tension on the fishing line. Maintaining this tension can be a difficult task if the fish jump or dive into grass. These issues can be recognized by separating the number of pulled hooks from the number of breakoffs.
The cover of the fishing area can impact the probability of landing the fish. Fishing in open water provides for more room to keep the fish loaded and away from obstacle. Cover that is heavy and contains sharp structures poses a risk that the fish will wrap the line around its mouth, or that the sharp structures in the cover may cut the line.
Each second that the fish is in contact with a rock pile or laydown area is another second that the fish may be lost to the angler. Therefore, the benchmark rate for success can drop if the fish are caught in heavy cover because it is more difficultly to land the fish in those conditions. The methods that are used to land the fish can result in the loss of some of the fish that are caught.
Using a deep net to land the fish can remove the final few second of the fight between the fish and the angler, while methods like hand grab or boat flip pose a risk to the fish becoming lost to the angler. If many of the fish are lost during the final phase of the fight, the ratio of landed fish to hookups will be lower than expected. This type of information can help anglers to make decisions regarding the type of net that is used or the method that is used while bringing the fish to the boat.
After completing a few fishing trips, the value of logging the number of hookups and landed fish becomes readily apparent. After logging a few trips, it is possible for the angler to recognize any pattern in which the fish are lost. For instance, the angler might notice that the ratio of landed fish decreases with the use of certain types of bait, or in areas with certain type of grass growth.
These types of observations can lead to specific changes in the fishing method that is used to catch fish. By separating the number of phases in which fishing occurs, anglers can adjust their fishing method to account for the loss of fish. Anglers can begin to notice if their rod tip is remaining loaded, if their drag is slipping correct, or if they are reaching for the net too early in the fight with the caught fish.
Each of these adjustment will result in the landing of more fish. Anglers will land more fish with this type of calculation because they understand in which phase they are losing their fish, and they have made adjustments to their fishing method to account for those lost fish.