River Discharge Estimator
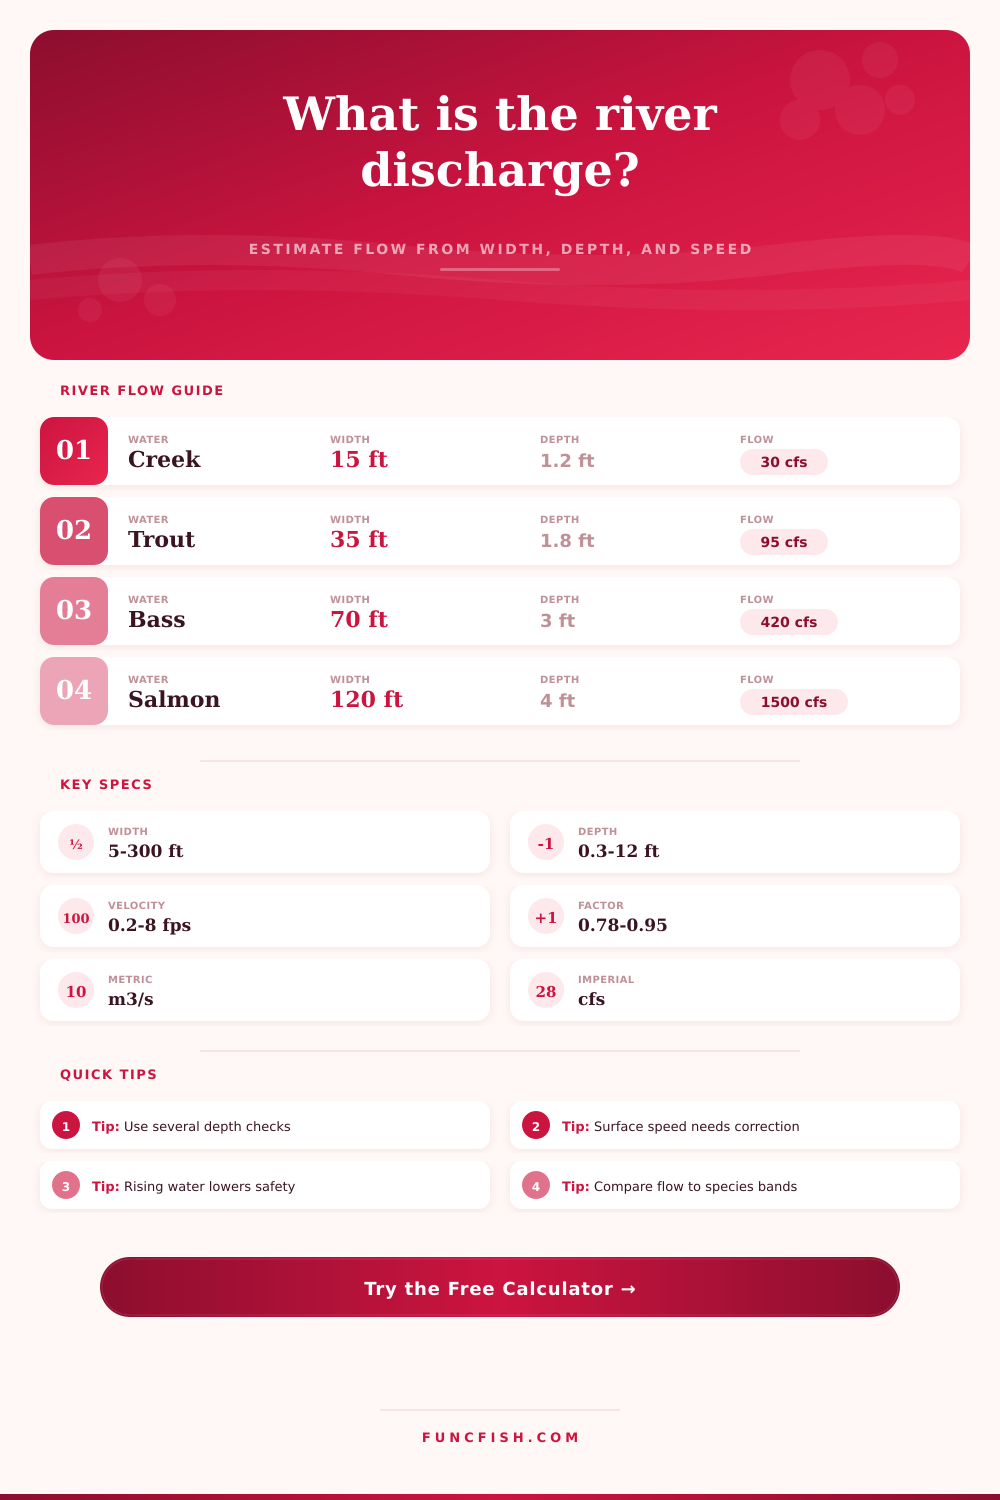
Estimate river flow from channel width, average depth, surface velocity, cross-section shape, and stage trend, then compare the result with practical fishing flow bands.
📌River presets
⚙Flow measurements
Measure only the active water width.
Use the average of several points.
Float timing should be converted to speed first.
More checks improve confidence.
River flow estimate
Full breakdown
📋Channel correction grid
Boxy Run
Rounded Bed
Riffle Pockets
Braided Lanes
📊River discharge references
| Preset water | Typical width | Average depth | Speed range | Estimated flow |
|---|---|---|---|---|
| Small trout creek | 8-25 ft / 2.4-7.6 m | 0.6-1.8 ft / 0.2-0.5 m | 0.7-2.4 ft/s | 10-90 cfs |
| Wadeable bass river | 30-90 ft / 9-27 m | 1.5-3.5 ft / 0.5-1.1 m | 1.0-3.0 ft/s | 80-650 cfs |
| Lowland catfish bend | 70-180 ft / 21-55 m | 3-9 ft / 0.9-2.7 m | 0.5-2.0 ft/s | 300-2200 cfs |
| Salmon migration channel | 90-300 ft / 27-91 m | 3-10 ft / 0.9-3.0 m | 2.0-6.0 ft/s | 1000-12000 cfs |
| Measurement method | Velocity factor | Best use | Likely bias | Confidence effect |
|---|---|---|---|---|
| Stick float timed run | 0.85 | Simple surface float | Reads surface too fast | Baseline |
| Bright float timed run | 0.82 | Windy or choppy water | May skate or drag | -4 points |
| Meter at 0.6 depth | 1.00 | Single-point mean speed | Good for moderate depth | +8 points |
| Two-point meter average | 1.00 | Deeper transects | Best handheld estimate | +12 points |
| Visual speed estimate | 0.78 | Fast scouting only | Often overstates speed | -14 points |
| Fast slick surface | 0.80 | Smooth chute surface | Surface outruns mean | -7 points |
| Discharge class | Approx cfs | Approx m³/s | Wading read | Fishing flow note |
|---|---|---|---|---|
| Skinny | Under 50 | Under 1.4 | Usually shallow | Good for small creeks |
| Wadeable | 50-300 | 1.4-8.5 | Check velocity | Often good for trout and bass |
| Pushy | 300-1000 | 8.5-28.3 | Selective wading | Edges and seams matter more |
| Heavy | 1000-5000 | 28.3-142 | Boat or bank bias | Large river species windows |
| Flooded | Over 5000 | Over 142 | Avoid wading | Score drops unless species band fits |
| Species / comparison grid | Comfort flow band | Comfort speed | Depth window | Best score trigger |
|---|---|---|---|---|
| Trout | 25-450 cfs | 0.8-3.2 ft/s | 0.8-3.5 ft | Cool riffle or glide |
| Smallmouth bass | 80-900 cfs | 0.7-2.8 ft/s | 1.5-5 ft | Moderate broken run |
| Largemouth bass | 40-600 cfs | 0.2-1.8 ft/s | 2-8 ft | Slow edge or back cut |
| Catfish | 250-4000 cfs | 0.4-2.2 ft/s | 3-12 ft | Deep bend with push |
| Walleye | 150-1500 cfs | 0.8-3.5 ft/s | 2-8 ft | Tailout or gravel lane |
| Steelhead | 350-3500 cfs | 1.5-4.5 ft/s | 2.5-7 ft | Travel slot with color |
| Salmon | 800-12000 cfs | 1.8-5.5 ft/s | 3-10 ft | Migration channel pulse |
| Pike | 60-1000 cfs | 0.2-1.6 ft/s | 2-6 ft | Soft side channel |
| Carp | 50-900 cfs | 0.1-1.4 ft/s | 1.5-6 ft | Slow glide or flat |
| Musky | 300-3000 cfs | 0.6-2.8 ft/s | 3-10 ft | Big structure with flow |
💡Measurement checks
Tip: Take depth readings across the transect and average them before entering depth. One center reading can overstate flow in rounded channels.
Tip: Surface floats usually move faster than the mean current, so the calculator applies a method correction before estimating discharge.
You are standing on the bank with a rod in your hands, staring down the rippling waters of a trout stream. The sun is shining, the water is clear and conditions appear ideal, the fish ought to be eating. But before you start casting, there’s one question that must be answered first: Is the current fast enough to hold food but slow enough to keep the fish?
The answer to this question will define variables of river discharge, an overlooked factor that determines everything from the fish’s diet, to its movement and hiding places. Once understood, it turns fishing from a guessing game into a calculated strategy.
How to Read River Flow for Better Fishing
After you enter the velocity, water level or depth, and width, the calculator does all the work for you (above). You don’t have to mess with units and coefficients and wrangle around trying to figure things out.
Most of us make error of measuring just the center of river. This is the fastest-moving part, which result in an over-estimation of the discharge. Because rivers aren’t straight pipes. They are a series of deep pools, slow eddies and fast lanes. So if you take one speed reading off a stick float, and one depth reading in the middle you’re probably going to end up with a number that’s way too high.
To account for this, you’ll estimate how water level differs from shape of riverbed below and what kind of surface correction to apply. A submerged current meter moves slower than bright orange float skimming the surface. The bright orange float skimmed across the surface quicker then another. A boxy run had a different area factor than rounded natural bed. Those things mattered because those were the details that closed the gap from “a rough guess” to an “usable estimate.”
What’s the distinction between a trout riffle and a largemouth bass backwater? On one side, trout love moving water with oxygenation, specifically velocities ranging from 25-450 cubic feet per second. That’s just enough current to bring them their preferred menu (insects), yet not so much that they tire while maintaining position. Conversely, bass are ambush predators. Stagnant pools, back cuts and slower edges of cover suits their tastes best. Perfect trout water may be dead water to bass. And vice versa.
This is where the reference table on the page makes sense; the comfort band changes in both speed and depth depending on which species is preferred. So next time you’re looking at an estimate of discharge, understand it isn’t just volume of water. It’s a habitat filter.
The most difficult parameter to get is velocity. The surface doesn’t feel any bank or bottom friction. Generally speaking, the surface speed isn’t equal to the mean speed. That’s where those surface correction factors comes into play in the calculator. When you time a float, you’re getting the surface speed, which is typically fifteen to twenty percent higher than the average. This will cause you to overestimate the flow if you don’t account for it, potentially leading you to believe the river is too high to fish when in fact it’s just right.
Professional hydrologists like to use a meter at sixty percent of depth because it provides a better estimate of the average velocity. And there’s a reason they do: using it improves your confidence score significantly.
Another place anglers scrimp is with depth checks. One check taken in the middle will give you a maximum. Five checks along a transect will give you an actual average. On a round channel, like many of them are, center might be deep but the edges shallow and difference can be huge. A few more checks increase your confidence. This confidence allows you to believe what the tool says enough to commit to one type of fishing strategy over another.
Did the tool say the flow was in the heavy range? Then go for bigger fish or head to deeper structure. Did it say wadeable flow? You’ll concentrate on edges and seams where food gets trapped.
So what does all this mean when it comes to river discharge? In short, it’s contextual. A rising stage can completely change the game by concentrating fish in deeper holes and flushing food from banks. As water falls it will clean up the river and put you into a sight fishing scenario. While the tool quantifies those variables, you still need to do some reading of the water as well. Listen for the roar of that riffle, look for color breaks and feel current on your legs. It won’t be a rule book but rather a guide.
When you learn how width, depth and velocity work together, you no longer react to the river, you begin to anticipate it. You stand there looking at the ripple and know precisely where to cast before the fish moves.