River Gauge Height To Wading Safety Calculator
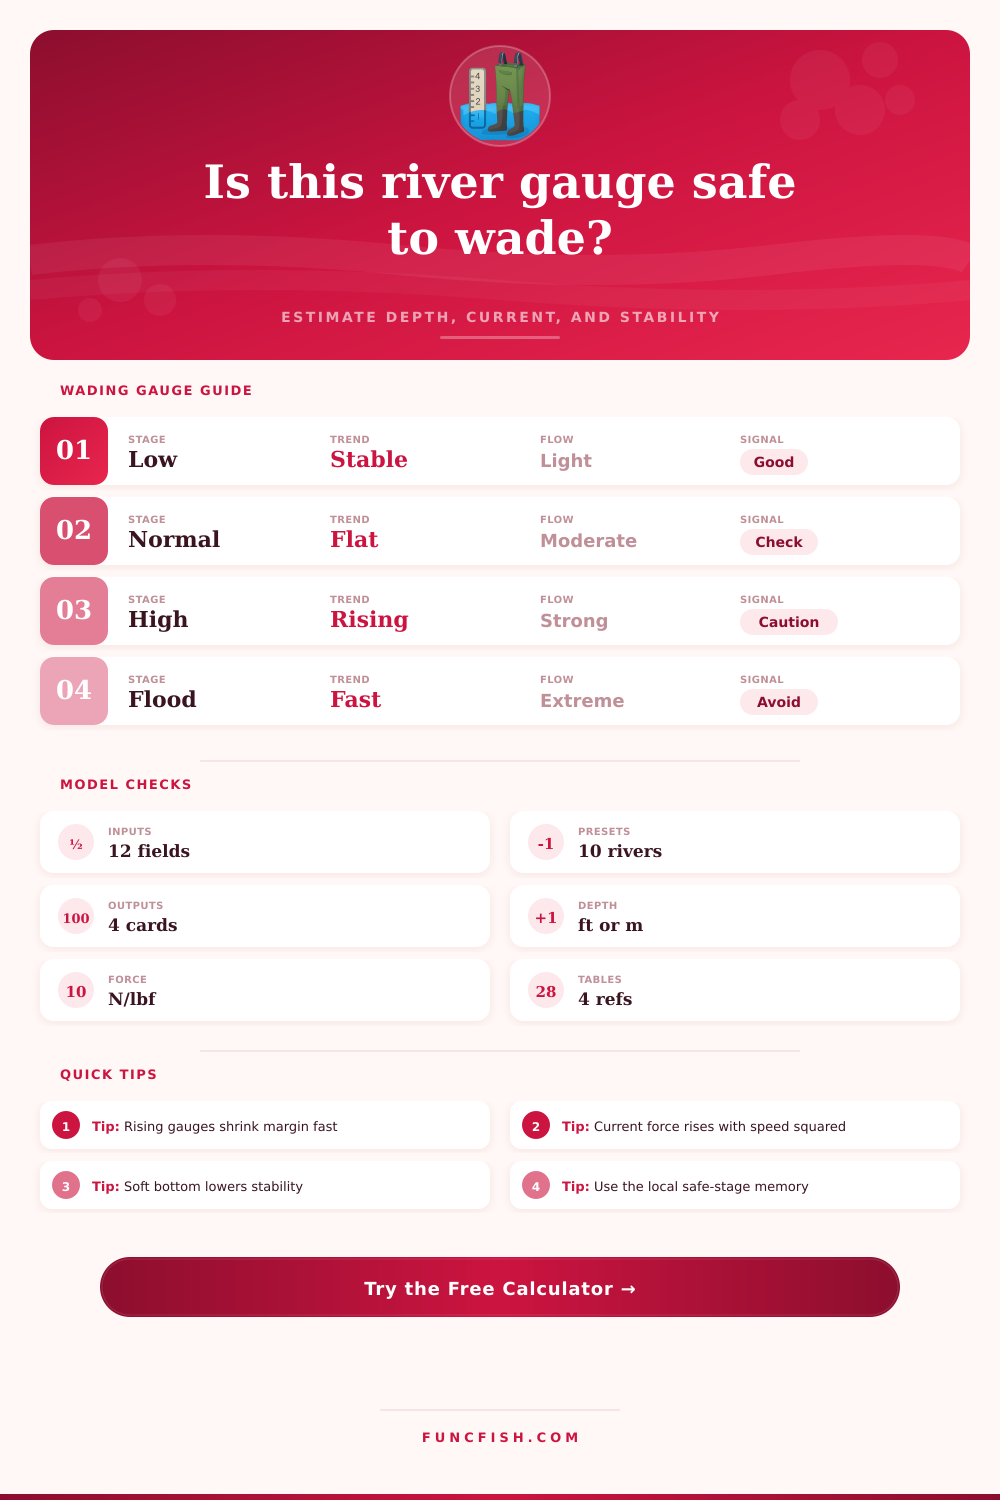
Estimate crossing depth, gauge-stage margin, current force, and wading stability from river gauge height, recent trend, local crossing memory, water speed, footing, gear load, and visibility.
📌Gauge and wading presets
⚙River gauge and crossing inputs
Gauge-to-wading safety estimate
Calculation breakdown
📊Model output grid
Available stance force divided by water push and route penalty.
Estimated water depth compared with body-height reference.
Extra allowance for rising, pulsing, or delayed gauge readings.
Estimated remaining depth before this route reaches a high-risk band.
⚖Crossing comparison grid
Short reposition along the bank with low exposure time.
Diagonal path across broken water with visible footing.
Longer mid-river exposure where fatigue and angle matter.
Constricted current where small stage changes feel large.
📘Gauge and wading reference tables
| Gauge signal | Stage offset from memory | Trend check | Depth response | Calculator use |
|---|---|---|---|---|
| Below memory stage | -0.50 ft / -0.15 m or more | Stable or falling | Often shallower at known crossing | Still check speed and footing |
| Near memory stage | Within about 0.50 ft / 0.15 m | Flat graph preferred | Local experience is most useful | Use direct depth and current inputs |
| Above memory stage | +0.50 to +1.50 ft / +0.15 to +0.46 m | Rising trend matters | Depth and velocity both increase | Reserve wider safety factor |
| Far above memory | More than +1.50 ft / +0.46 m | Rising or pulsing | Crossing shape may change | Treat estimate as unfavorable |
| Current speed | Field cue | Force behavior | Footing sensitivity | Wading signal |
|---|---|---|---|---|
| Under 1 mph / 0.45 m/s | Slow bubbles, easy stance | Low drag on legs | Bottom matters less | Often manageable if depth is low |
| 1 to 2 mph / 0.45 to 0.89 m/s | Noticeable push | Force rises quickly | Staff and studs help | Use deliberate diagonal steps |
| 2 to 3 mph / 0.89 to 1.34 m/s | Strong push on thighs | About four times 1 mph load at same depth | Slippery bottom dominates | Needs large reserve |
| Over 3 mph / 1.34 m/s | Pushy water, standing waves | High drag and balance loss | Small slips matter | Usually poor for crossing |
| Bottom type | Traction factor | Best input match | Main effect | Reserve note |
|---|---|---|---|---|
| Firm gravel | Good | Firm gravel | Predictable foot plant | Good baseline for calculator memory |
| Rounded cobble | Mixed | Rounded cobble | Ankles roll and stones move | Reduce confidence in fast current |
| Bedrock or weed rock | Variable | Clean bedrock or algae rock | Slip risk can change step to step | Footwear choice matters more |
| Sand, silt, or mud | Low | Shifting sand or soft silt | Feet sink, slide, or stall | Depth margin should be larger |
| Input group | Why it matters | Low-risk direction | High-risk direction | Output affected |
|---|---|---|---|---|
| Gauge stage and trend | Approximates reach-wide water level change | Below memory and falling | Above memory and rising | Stage margin and depth reserve |
| Depth and current | Sets projected leg area and hydrodynamic push | Shallow, slow water | Thigh to waist depth in fast flow | Current force and stability index |
| Boot, bottom, clarity | Controls available friction and step placement | Studs or staff on visible gravel | Plain sole on slick or hidden footing | Stability class |
| Body, load, skill, route | Adjusts reserve for balance and exposure time | Practiced short crossing | New route with heavy pack | Safety factor and comparison grid |
✅Calculation tips
“It looks like glass to us on shore, so we get in trouble. Then I think about going down to that riffle, because I saw some trout up there, and I crossed it yesterday when it was calm.” And before long, your mind’s made up: It’s time to fish. Except that as soon as you step in the water, the current will grab hold of your legs, hard.
You need to know how to read river gauges and apply that information to your gear and body weight. Doing this can be the difference between a good day and a bad day, or even needing rescue. Water height is part of the equation, but so are its speed, source, and level of resistance beneath your feet.
How to Stay Safe When Fishing in Rivers
Enter: the stability index calculator, which helps translate those airy stage numbers into something tangible. First, create a memory stage, this is a starting point to compare how deep you were comfortable standing on that crossing when you was there before. When the gauge goes up just a little over that number, it’s very easy for margin for error to become tight real fast.
In most river systems, as the stage goes up, so does water depth, but not linearly. Even a small increase on the gauge can mean more water over the top of your boots. This means more of your body are exposed to the current. The longer your legs is under water, the more you act as a sail catching water pressure pushing you downstream no matter how strong your legs are. It’s a geometric trick that traps even experienced anglers who get caught up on what depth mean vs projected area.
So what about the current? What about its power? That’s where the velocity input comes into play. The force of the current doesn’t increase at a steady rate with velocity; it increases proportionally with the square of velocity. In other words, doubling the current from two miles an hour to four doubles the force on your body and quadruples the lateral drag. So, a fast flowing shallow river will be more dangerous than a deep slow moving one. And the tool’s reference tables makes that very clear. It shows how force differs depending on speed and bottom type. When you think about being able to stay in place relative to the current, you should of take the squared effect into account. If the gauge reading trends up, then consider that the current is speeding up as well… Faster than water rise would indicate.
So what does that mean? Footing makes all the difference in the world. If you have a solid gravel bottom where you can count on getting some good footing with your wading staff and boots, then you have something to work with. Move to a slick algae covered rock or a sandy bottom with shifting surface sediment, and your effective stability goes down quite a bit. Your bodyweight has to provide much more force downward to keep you rooted to prevent sliding around. That’s why the tool separates out the bottom composition from the type of sole on your boots. A studded rubber sole on bedrock gives you a different safety profile than a felt sole on silt, even if the water depth remains identical. Silt with your felt sole, it presents a different safety profile. Because your traction is a relationship between your gear and riverbed, not a fixed constant, the stability class will adjust to match.
The risk in cold water doesn’t get completely measured by numbers. You don’t need to be up to your waist all day to become hypothermic. Thirty minutes in water that’s only forty degrees is long enough to reduce fine motor functions. This makes a simple step become awkward. Then it’s on. That’s where the current kicks in. The temp input will help you guess how much time you have before you feel sick and become too weak to act. When water temps are cold and that gauge is climbing, nearly every time; the suggested course of action is to cut bait. Nothing you can do with skill counters the body’s physiological response to cold water shock + moving target.
At the end of the day, wading safety is all about uncertainty. By calculating an estimate for your depth reserve and assigning a stability class, the tool offer a way for weighing what you know against what you don’t know in a structured manner. However, it’s no substitute for looking down from the bank, standing up and seeing how the water interacts with rocks, as well. If you see that the flow is turbulent where you intend to go, or that there are pieces of debris crossing your route, then the numerical estimate takes a back seat. Use the data when it confirms what you see, but follow your gut when it doesn’t.
The river doesn’t give a rip about your plans; it only cares about whether or not you’re prepared. Keep a constant memory of what stage is present and understand how friction and drag work on your body. Doing so will keep you safe while you fish.