Sustainable Harvest Rate Calculator
Estimate a fisheries-planning harvest rate from population size, annual recruitment, natural mortality, productivity, selectivity, harvest size, and target exploitation.
📌Species and fishery presets
⚙Stock and harvest inputs
Harvest planning estimate
Calculation breakdown
📊Species productivity grid
Slow
Moderate
Fast
Variable
📘Reference tables
| Species group | Typical productivity | Planning exploitation band | Conservative note |
|---|---|---|---|
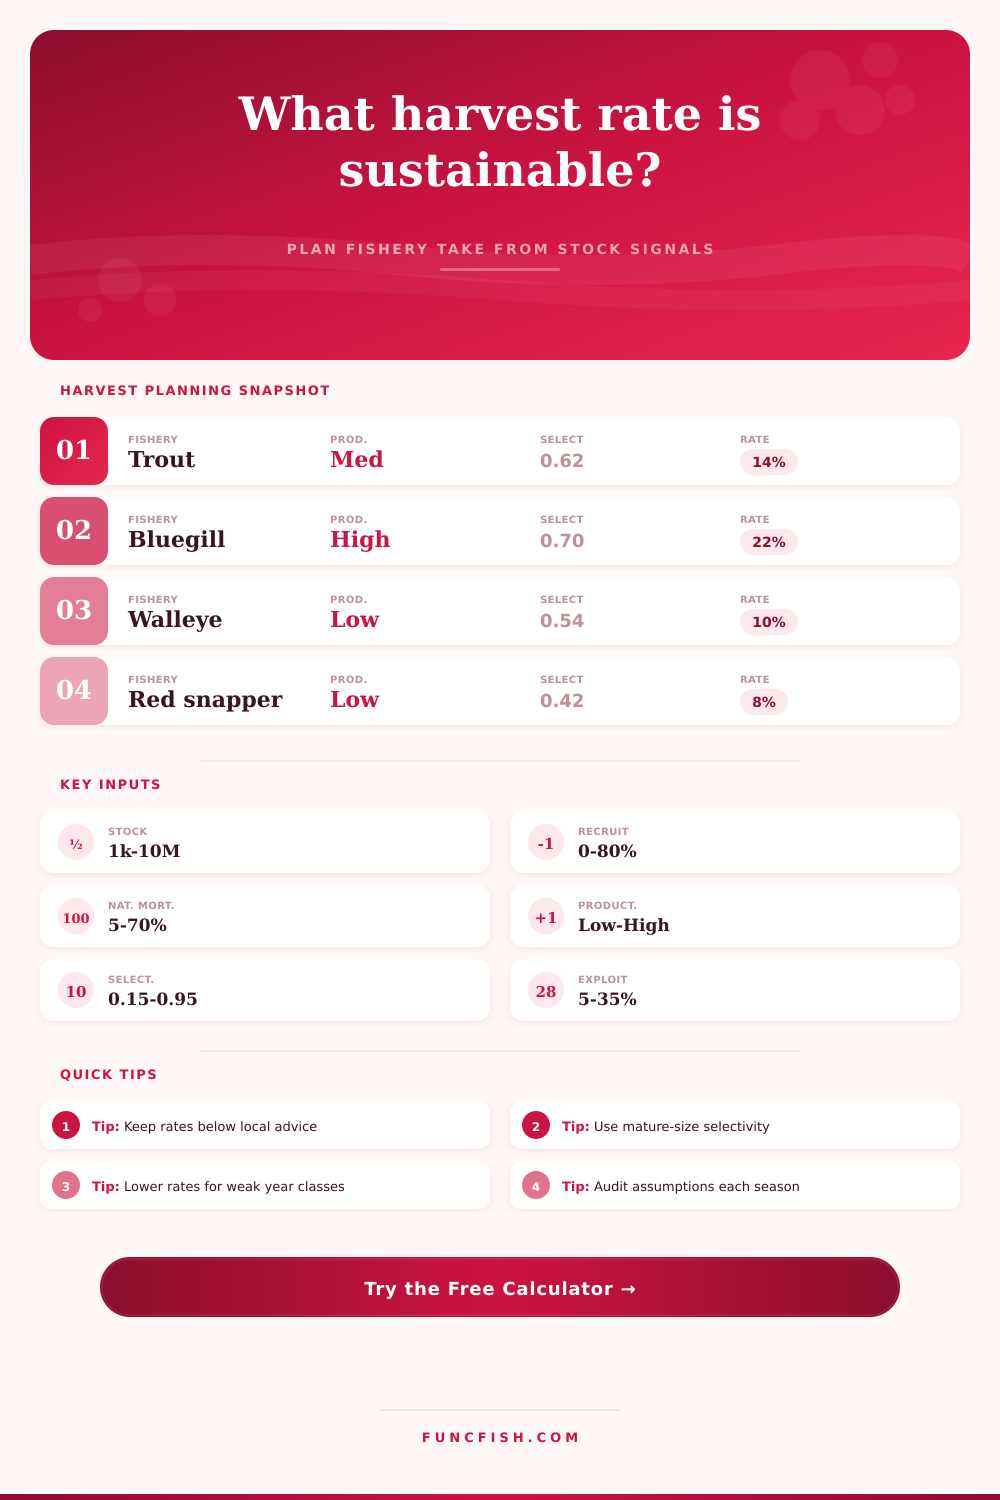
| Coldwater trout stream | Moderate, habitat limited | 8-16% of exploitable fish | Reduce when recruitment depends on few spawning reaches. |
| Bluegill or sunfish pond | High, early maturing | 15-28% of exploitable fish | Watch size structure so harvest does not remove too many large fish. |
| Walleye or sauger lake | Low to moderate | 6-14% of exploitable fish | Use lower rates during weak year classes. |
| Black bass reservoir | Moderate | 10-18% of exploitable fish | Size-selective harvest can shift age and size structure quickly. |
| Reef snapper fishery | Low, long-lived | 4-10% of exploitable fish | Keep buffers high when age data are sparse. |
| Input signal | Low concern | Moderate concern | High concern |
|---|---|---|---|
| Recruitment replacement ratio | Above 1.20 | 0.85 to 1.20 | Below 0.85 |
| Natural mortality | Under 18% | 18% to 35% | Over 35% |
| Harvest size over maturity | 130% or more | 105% to 130% | Below 105% |
| Angler selectivity | Under 45% | 45% to 70% | Over 70% |
| Productivity class | Multiplier | Recruit survival guide | Planning interpretation |
|---|---|---|---|
| Very low productivity | 0.62 | 10% to 25% | Long-lived, slow growth, strong buffer needed. |
| Low productivity | 0.78 | 18% to 35% | Use narrow exploitation targets unless monitoring is strong. |
| Moderate productivity | 1.00 | 30% to 50% | Balanced planning class for many inland fisheries. |
| High productivity | 1.22 | 45% to 70% | Can support higher harvest when size structure remains healthy. |
| Boom-bust recruitment | 0.88 | 15% to 65% | Use added caution because one strong year can mask weak follow-up. |
| Harvest size relation | Maturity factor | Planning effect | Example response |
|---|---|---|---|
| Below maturity size | 0.55 to 0.80 | Strong rate reduction | Raise harvest size or lower take. |
| Near maturity size | 0.80 to 1.00 | Moderate reduction | Protect first-time spawners. |
| Well above maturity | 1.00 to 1.15 | Little reduction | Check large-fish age structure. |
| Trophy-selective harvest | 0.70 to 0.95 | Size-structure caution | Use slot or protected-size planning separately. |
💡Planning tips
Tip: Treat the output as a screening estimate. Before setting any real harvest objective, compare it with creel surveys, age structure, local stock assessment work, and applicable agency guidance.
Tip: Recalculate after poor recruitment, drought, winterkill, disease events, or sharp effort changes. The safest harvest rate is usually the one that stays stable under pessimistic inputs.
Timing and biology is critical parts of sustainable fishing, but the word alone doesn’t cover everything. It isn’t just about catching fewer fish. It is about catching them at the right time and in the right way so the fishery stay healthy and full of fish. Sustainable harvest rate calculator takes the complicated mathematical work out of it for you and turns biological assumptions into a defined range of sustainability. It eliminates the guessing game of how much you should be taking vs what the fishery’s replacement rate is.
Not every fish population are built the same way. You need to know that each species differ. For instance, snapper on a reef take years to reach maturity and start reproducing while bluegill in a warm pond bounce back rapidy. That makes all the difference. If you treat a slow-growing stock like a fast-growing one, you will run out of water before you realize there is an issue.
How the Sustainable Fishing Calculator Works
By allowing you to choose a productivity class with the tool, you’re basically telling the system how resilient the population is. If it’s high productivity then the stock can absorbs more pressure, however, low productivity indicates you’ll want to be more cautious. It’s a tiny little distinction in the drop down menu but it makes a huge difference in the outcome.
The entire system revolves around the recruitment engine (i.e., how many young fish survive to become part of next year’s adult population). You can’t take something from the fishery that isn’t there, and when recruitment is low, the fish stock are essentially running on fumes. Using this input in the calculator help determine if the population is growing, staying steady, or declining. A recruitment ratio less than one mean the population is declining, even absent any fishing pressure, so that is a red flag. And the reference table on the page clearly lays it out: That means you should of reduce your harvest targets right away. The table shows how various levels of recruitment will move the acceptable level of harvest up or down.
What anglers catch is what they see and hook, meaning they don’t catch all the fish in the water. If your technique or equipment target fish that are only just barely over legal size, you’re also taking fish that aren’t contributing much (if any) to the next generation. The calculator look at maturity size compared to harvest size. It then reduces your allowable take to match if you are taking fish that is nearing maturity but still haven’t had the chance to spawn.
The other side of the coin is that fish do die naturaly from weather, predators, disease and just plain old age. This you can’t control, but you can control fishing mortality. So the idea is to maintain the total combined pressure in a safe range. If natural mortality is high, then the stock is already stressed. Adding excessive fishing pressure on top of it are a recipe for failure. The calculator mixes these two types of mortality together to determine the safe zone.
Experience come into play with risk buffers, as a manager out in the field understands there’s no such thing as perfect data, whereas a lab-based biologist could go for the theoretical max sustainable yield. That’s a safety net. A precautionary buffer is an option in the tool. If you don’t know how large a population is, use a bigger buffer. You want to err on the side of caution rather than explaining away a collapsed stock at a later date.
Consider this tool a starting point for discussion instead of the final decision maker. It is a starting point where we input our own assumptions and expectations, but we must realize that real fisheries gets messy. The effort goes up and down, the weather changes. You want to use the calculator’s result as a maximum limit and then stay well below it. Pay attention to how many you are catching and make adjustments accordingly because sustainable harvest isn’t some magic number. It takes practice. Focus on the overall health of the stock, and the fish will continue to return.