Fishing ROI per Season Calculator
Estimate seasonal return from harvest weight, catch volume, time on the water, and shared investment so each fishing program can be compared on the same basis.
📌Season presets
⚙Season inputs
Season ROI results
Formula breakdown
📊Return weighting grid
Kept weight multiplied by the selected per-unit value.
Released fish add a small engagement credit without inflating harvest.
Fishing time can be credited separately from kept catch.
Trip load is divided across the anglers sharing the season plan.
📋Season reference tables
| Fishing program | Typical trip count | Harvest role | ROI driver |
|---|---|---|---|
| Panfish harvest days | 8 to 18 trips | High kept weight for effort | Steady harvest and short travel |
| Bass mixed keep/release | 12 to 28 trips | Low harvest, high release count | Hours and catch activity matter most |
| Trout creek season | 6 to 20 trips | Moderate harvest window | Efficient short sessions improve ROI |
| Walleye boat program | 8 to 22 trips | Strong harvest potential | Crew sharing and keeper weight |
| Offshore shared crew | 2 to 10 trips | High swing per trip | Large harvest offsets fewer outings |
| Harvest band | Imperial | Metric | Planning note |
|---|---|---|---|
| Light keeper season | 10 to 30 lb | 4.5 to 13.6 kg | Use low replacement value |
| Moderate keeper season | 31 to 80 lb | 14.1 to 36.3 kg | ROI depends on trip count |
| Strong keeper season | 81 to 160 lb | 36.7 to 72.6 kg | Harvest drives most return |
| High-yield shared season | 161 lb or more | 73 kg or more | Share math prevents overcounting |
| Program type | Catch pattern | Best comparison metric | Calculator adjustment |
|---|---|---|---|
| Harvest-focused trips | Fewer releases, more kept weight | Harvest per hour | Higher harvest value weight |
| Sport-focused trips | Many releases, fewer keepers | Fish contacted per trip | Release credit helps compare activity |
| Shared boat outings | Group effort and shared return | Return per angler trip | Crew size divides harvest and hours |
| Short local sessions | Low load, frequent outings | Net return per hour | Hours reveal efficiency quickly |
| ROI result | Meaning | What to compare | Useful next check |
|---|---|---|---|
| Below 0% | Investment exceeds modeled return | Trip count, crew share, harvest value | See return per trip |
| 0% to 50% | Positive but modest season | Harvest rate and release activity | Check hours per trip |
| 51% to 150% | Strong balanced season | Kept weight and trip efficiency | Compare with alternate program |
| Above 150% | High-return fishing plan | Data realism and shared portions | Confirm logged catches |
💡Calculation checks
Tip: For shared trips, enter only your season investment, then set the angler count to match how the harvest and fishing hours are actually shared.
Tip: Keep release credit modest. It is meant to compare active catch-and-release seasons, not replace the harvest side of the ROI formula.
For most of us, the success of any given fishing season are marked by size of our largest keeper or how many fish we have in freezer. While those is good measures of bragging rights, they don’t say anything about getting your money’s worth.
Fishing is an investment. It is an investment of time, money, and patience. When we treat it as such, we make the hobby not only more enjoyable, but also more intelligent, stopping us from chasing empty excitement and instead aiming for true satisfaction.
How to Calculate Your Fishing ROI
Enter the calculator. It does the heavy-lifting here. Taking your raw logs of hours, trips, and harvest weight, it translate them into a clear return on investment figure that allows you to put a costly offshore charter on the same playing field than a quick panfish run.
First things first: Not everything has monetary value. When you’re counting how much money each bass in boat is worth, you’re leaving out a ton of factors. The excitement of the battle, time spent casting, and social component of fishing trips aren’t measured here. To address these, the tool allow users to count the value of recreation toward their time spent fishing.
For those who practice catch-and-release, this is essential because without it, you’d lose sight of non-monetary rewards of spending time on water, which could lead to a net-negative return. The truth is, you don’t pay for protein; you pay for the experience. Without that credit, a trip in which 10 large trout were caught and released would appear to be an economic disaster. Obviously, that’s not how any avid angler think about it.
Splitting expenses completely alters the equation. The crew splits the cost of guide fees, bait, and fuel. That reduces your individual investment a lot. Maybe your portion of the catch havent changed at all. To accommodate that, the calculator ask how many anglers will be splitting the cost. It then divides up your investment accordingly. This keeps you from inflating the cost of a team outing. You’re not paying full price for fuel if you have three buddies in a boat share.
By far the biggest error people make when attempting to gauge their efficiency is forgetting the share factor. They look at how much money they spent versus what the entire crew caught, and that paints an inaccurate picture.
Harvest efficiency is another way to tell the difference between guessing casualy and actualy planning. That is, when you consider how many hours it takes to make a day’s harvest, not just the amount of fish harvested. So if you go on a six hour outing and catch two pounds of fish, it’s not as good than going out for two hours and catching the same amount of fish. It doesn’t matter what the headline number of pounds of fish caught is, it matters how long you invested to get those fish.
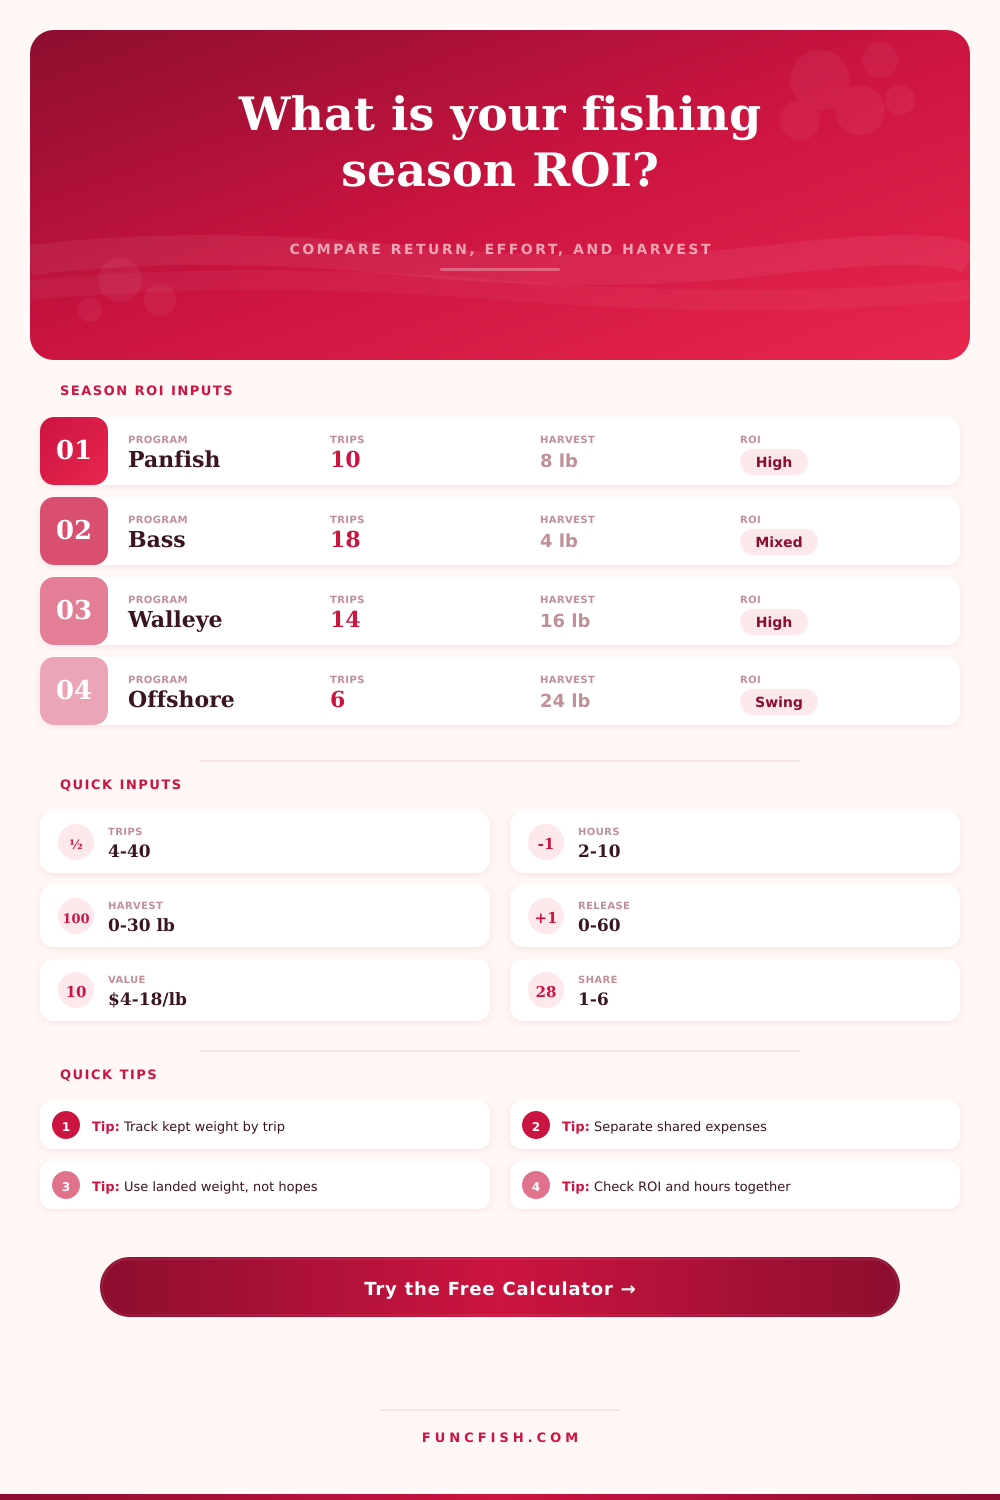
The table on the page give you some context for what these numbers mean. They are typical ranges for common programs. Generally walleye trips requires a large initial investment and will pay off in big bags of fish. Local panfish days will require modest effort and offer steady rewards.
You need to look at the ratio of your input/output. Don’t just look at the headline number. Don’t overestimate how much fish you think you’ll catch. New anglers tend to put their best-case guess into the equation. “I’m gonna get a limit everyday.” That’s not how real fishing goes. There are going to be off days. Missed bites. Bad weather.
Use the landed weight information, not hope, in this equation. If you have historical records, pull them out. If you’re starting from scratch, play it safe. It’s way more satisfying to exceed an overly conservative estimate than it is to under-deliver on an optimistic one.
So what is the ROI of fishing? The answer isn’t that it’s a spreadsheet solution for your favorite pastime. It’s about being aware off your decisions.
Perhaps you’ll learn that those costly fly fishing excursions aren’t quite as rewarding from a return standpoint… until you add that recreation credit. And now it’s worth every dime. Or maybe you discover that your humble bass fishing adventures is indeed the best way to get the biggest bang for your buck.
When you know the numbers, you can consciously direct your finite seasonal dollar toward the things that really pay off. What was once a hunch or general sense of gratification becomes cold hard proof that you planned well this season. After all, you see how the numbers go and how they affect that final percentage. This makes you want to take your fishing more serious than ever before. You should of fished more, but you must also fish smarter.