Electrofishing Catch Rate Calculator
Estimate electrofishing CPUE from shocked time, shoreline distance, netters, catch, species, conductivity, visibility, habitat, and gear efficiency.
📌Survey presets
⚙Electrofishing effort inputs
Electrofishing CPUE results
Full breakdown
📋Species and survey gear grid
Backpack DC
Tote Barge
Boat Boom
Raft Unit
📊Reference tables
| Species / guild | Base factor | Typical gear | Catch note |
|---|---|---|---|
| Trout and salmonids | 0.92 | Backpack / tote | Responsive in cool streams |
| Black bass | 0.88 | Boat / tote | Good near cover edges |
| Sunfish and panfish | 1.00 | Boat / backpack | Often easy to net |
| Small-bodied minnows | 0.72 | Backpack | Escapement rises with flow |
| Walleye / sauger | 0.66 | Boat boom | Lower visibility response |
| Catfish and bullheads | 0.58 | Boat boom | Benthic fish are undercounted |
| Carp and suckers | 0.78 | Boat / tote | Large fish net well in open water |
| Mixed warmwater assemblage | 0.82 | Boat / raft | Balanced multi-species factor |
| Conductivity | Modifier | Field meaning | Adjustment cue |
|---|---|---|---|
| Under 50 uS/cm | 0.52 | Very low transfer | Expect lower catchability |
| 50-100 uS/cm | 0.72 | Weak to fair transfer | Increase attention to netting |
| 100-300 uS/cm | 0.96 | Common working range | Good index conditions |
| 300-700 uS/cm | 1.04 | Strong response window | Watch avoidance and narcosis |
| 700-1200 uS/cm | 0.88 | High current load | Efficiency may taper |
| Over 1200 uS/cm | 0.66 | Difficult control | Standardization is critical |
| Survey preset | Fish/hr guide | Shore guide | Best comparison use |
|---|---|---|---|
| Wadeable trout riffle | 20-80 fish/hr | 60-250 fish/km | Reach-to-reach trout trend |
| Boat largemouth cove | 30-110 fish/hr | 40-160 fish/km | Cove and shoreline index |
| Backpack headwater minnow | 10-70 fish/hr | 80-400 fish/km | Small stream assemblage |
| Reservoir shoreline index | 25-100 fish/hr | 20-120 fish/km | Annual fixed station trend |
| High conductivity carp edge | 40-180 fish/hr | 30-150 fish/km | Large-bodied edge catch |
| Condition | Low CPUE | Moderate CPUE | High CPUE |
|---|---|---|---|
| Open shoreline | Under 20/hr | 20-80/hr | Over 80/hr |
| Moderate cover | Under 15/hr | 15-65/hr | Over 65/hr |
| Dense vegetation | Under 10/hr | 10-45/hr | Over 45/hr |
| Low conductivity | Under 8/hr | 8-35/hr | Over 35/hr |
💡Calculation checks
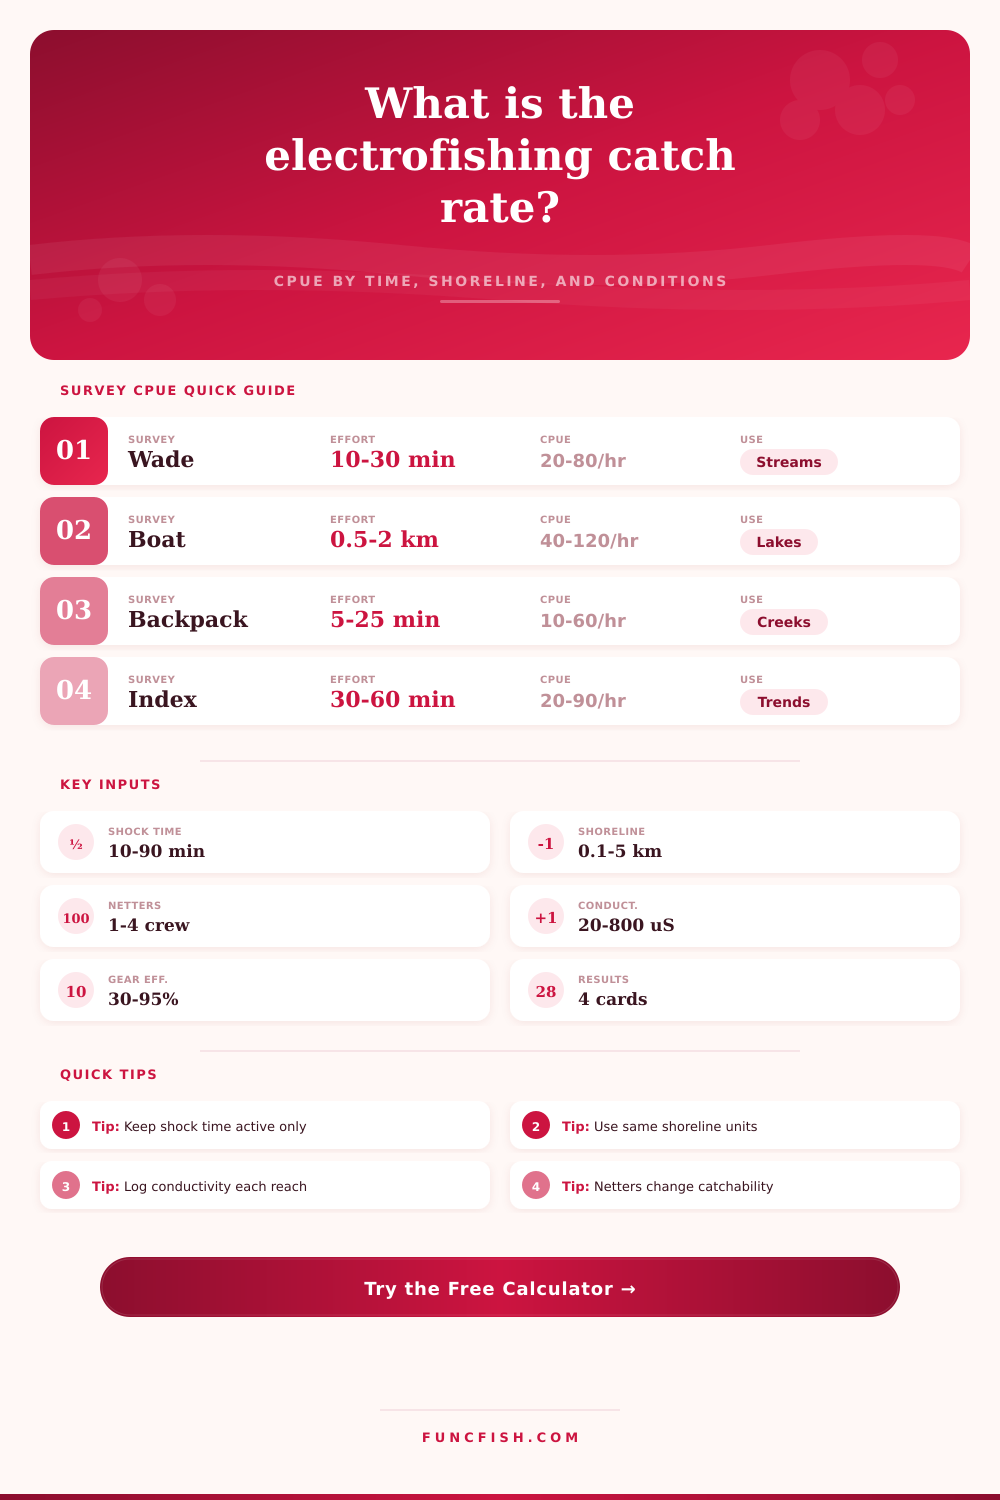
Tip: Use only active shocking time. Handling, measuring, travel, and reset time should stay out of the CPUE denominator unless your protocol defines otherwise.
Tip: Compare adjusted CPUE only among surveys with similar protocols. The adjustment helps interpret conditions; it does not replace a calibrated depletion or mark-recapture estimate.
Catch rate is one of those things field biologist like to argue about. It is not simply a matter of how many fish you caught, but how you handle the math after the catch. Shock a stretch of stream, walk down a reach, and count up what came through. Seems good enough until someone starts asking about water clarity or length of time the stretch was shocked.
Enter the calculator; it turns raw numbers into standard indices that is comparable among themselves. And it subtracts noise of effort level differences so you can truly compare site to site.
How to Measure Fish Catch Rates Correctly
Don’t confuse shock time with straight clock time. Only include minutes that you are actualy shocking the water. Resetting equipment and traveling to different areas should of not apply. Including travel time artificially deflates catch per unit effort. It can make it appear as if there aren’t many fish around when they’re perfectly fine. With this tool, you separate actual shock hours from total field time, that keeps your baseline honest.
New techs don’t understand how much water chemistry impact things. How much does it impact the transfer of current to the fish? That’s called conductivity, and if you have very low conductivity water, that electric field spreads out. It take more voltage for the fish to react. Your inputs are used as a catchability modifier in calculator. You recognize there is a difference between 20 fish in clear water and 20 fish in muddy water. So it’s not just about catching fish but measuring how efficienty you detect them.
Another variable is habitat complexity. Undercut banks and thick vegetation offers shelter from electrical pulses. Obviously, surveys done in snarled backwaters will have fewer numbers then those in an open riffle habitat. This happens even when the real-world fish density are equal. That’s where the adjusted index corrects structural bias. It provides a reality check on numbers that might be deflated or inflated. It does not replace careful survey design.
The data is skewed by species behavior too. Sunfish disperse well, so they can be under-represented (netting should be brisk). In contrast, trout tend to show consistent responses to a given set of microhabitat condition. Catfish stays on the bottom and have their own equipment settings. These baseline factors are outlined in the tool’s reference tables. They demonstrate how one catch rate does not apply across all groups equaly. To understand what you don’t see, you need to know what you are looking for.
Effort is important and that’s something protocol documents don’t always acknowledge. One net does not cover as much lateral area as two do. Three is better then two. Different crew combinations over the course of survey years will affect catch rate independent from fish abundance. You can plug in how many netters are actually active. That makes it easier to standardize effort among teams or at different times of the year, it also makes you consider the limits of your people rather than just your equipment.
The point isn’t that it’s perfect. It’s meant to standardize. There’s no one number that includes everything about ecosystem. The adjusted amount caught for each effort is for trend analysis. Is this stretch of water better or worse than it was? If the adjusted index goes down, then you consult your notes. Was there an increase in complexity? Was the water more conductive? If all things were equal, then yeah, it probably got worse.
Because it’s field data, it’s messy. It gets wet, hot, cold. Stuff breaks. Weather changes. Water levels rise and fall. A calculator can’t rectify poor science. It creates a level playing field on which to report results.
You must go out and see the fish; you still has to walk the stream. Use your eyes. Letting everyone know there’s a number involved saves someone else from having to argue over who lugged the generator. An afternoon effort becomes a justifiable data point. You’re creating a record that will survive the storm.