Fish Burst Speed Estimator
Estimate short-duration fish sprint speed from body length, species group, water temperature, condition, morphology, and the current or flume velocity the fish must beat.
🐟 Burst speed presets
⚙ Fish and water inputs
Burst speed estimate
Calculation breakdown
📊 Live performance checks
Multiplier from the water temperature and species optimum.
Converted length used by the BL/s speed model.
Distance gained after subtracting opposing current.
Quick screen of speed margin for the entered flow.
⚖ Comparison grid
Routine swim
About 1 to 3 BL/s. Useful for normal cruising, station holding, and low-stress movement.
Sustained fast
About 3 to 6 BL/s. Can last longer than a burst but depends strongly on oxygen and temperature.
Burst sprint
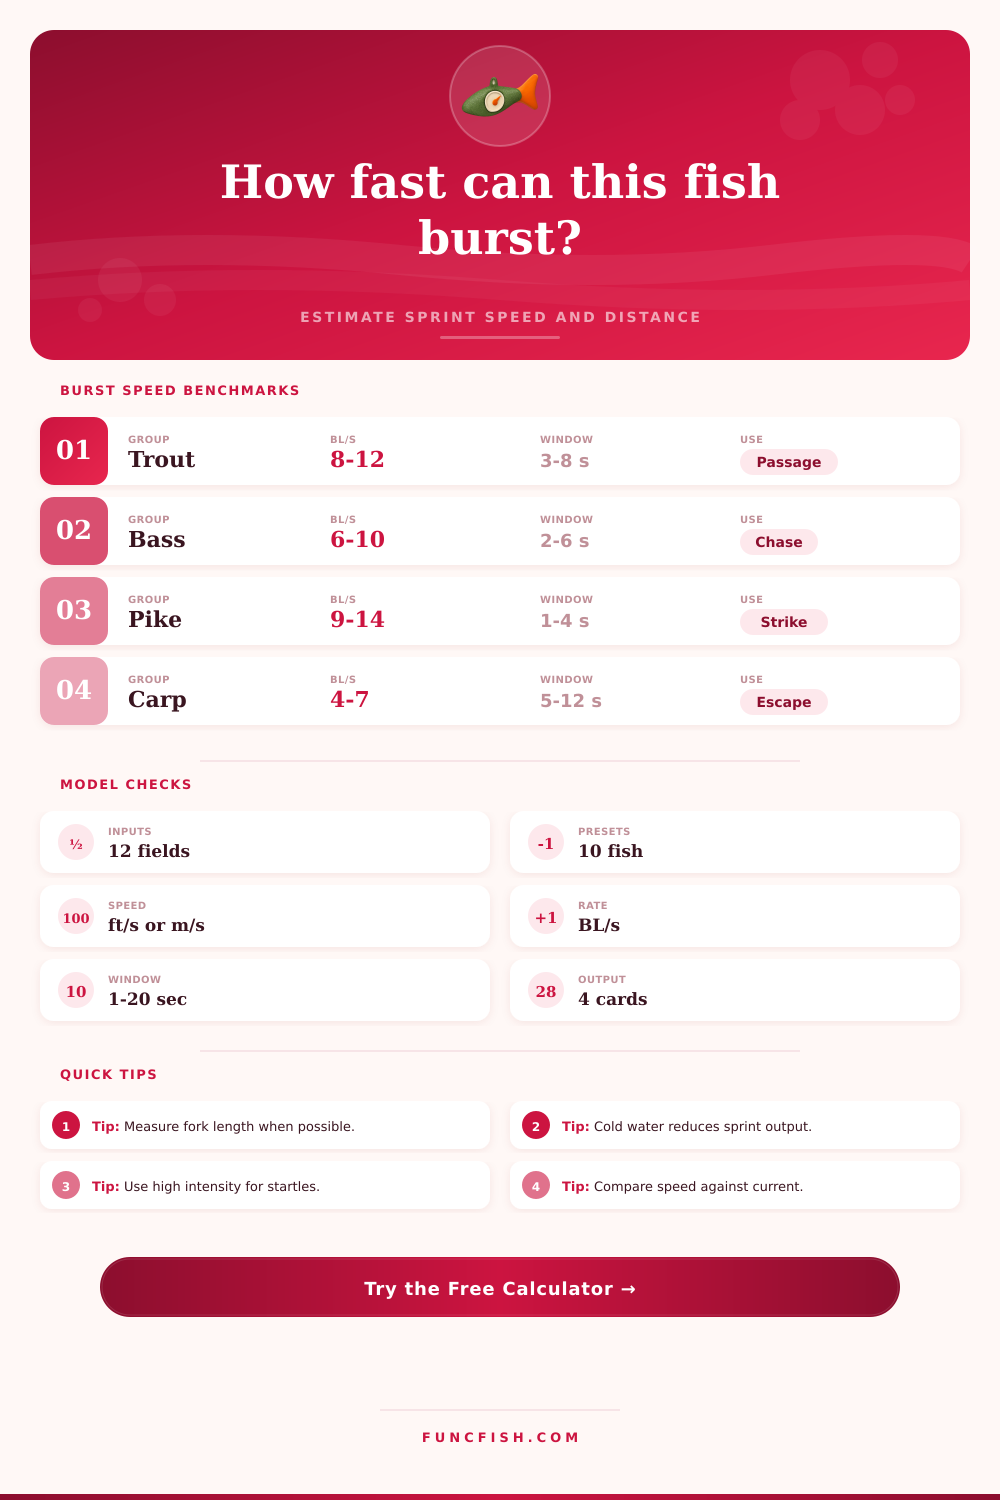
About 6 to 12 BL/s for many sport fish. Best for short chases, escapes, and passage attempts.
Startle max
Often above 10 BL/s in strong swimmers, but the useful window is brief and fatigue rises quickly.
📘 Reference tables
| Species group | Baseline BL/s | Temp optimum | Model note |
|---|---|---|---|
| Trout / char | 10.2 | 52 to 58°F / 11 to 14°C | Coldwater salmonids often sprint well in cool, oxygen-rich flow. |
| Bass / sunfish | 8.2 | 70 to 78°F / 21 to 26°C | Good ambush burst speed, with deep-bodied species lower than black bass. |
| Pike / muskie | 12.2 | 58 to 66°F / 14 to 19°C | Elongate predators can produce strong short strikes with rapid fatigue. |
| Salmon / steelhead | 11.4 | 50 to 58°F / 10 to 14°C | Passage estimates should keep a generous fatigue and turbulence margin. |
| Carp / buffalo | 5.8 | 68 to 78°F / 20 to 26°C | Strong fish, but burst BL/s is usually lower than streamlined predators. |
| Catfish / bullhead | 5.2 | 72 to 82°F / 22 to 28°C | Benthic body form and broad head create a larger drag penalty. |
| Redfish / drum | 8.8 | 68 to 80°F / 20 to 27°C | Coastal sport fish often show strong short sprints in warm, oxygenated water. |
| Tuna / mackerel | 14.5 | 64 to 76°F / 18 to 24°C | Pelagic form supports high speed, but lab-to-field transfer needs caution. |
| Input factor | Low setting | High setting | Effect on estimate |
|---|---|---|---|
| Condition factor | 0.75 to 0.90 | 1.05 to 1.20 | Scales muscle output for body condition and handling state. |
| Effort intensity | 0.78 conservative | 1.12 startle max | Controls whether the model reflects a cautious sprint or an escape burst. |
| Morphology | 0.84 benthic | 1.14 pelagic | Adjusts for drag from body depth, head shape, and fin profile. |
| Turbulence penalty | 0 to 8% | 25 to 60% | Reduces usable speed in rough flow, cover, or tight passage paths. |
| Duration window | 1 to 3 seconds | 10 to 20 seconds | Longer windows apply a stronger fatigue discount to peak BL/s. |
| Water speed screen | Margin ratio | Likely interpretation | Best use |
|---|---|---|---|
| Blocked | Under 1.0 | Fish cannot make net upstream progress at the entered burst speed. | Rejecting a rough passage assumption before field review. |
| Narrow | 1.0 to 1.3 | Possible for fresh, motivated fish, but fatigue and turbulence may dominate. | Checking culvert, chute, or fishway edge cases. |
| Workable | 1.3 to 2.0 | Moderate margin if the burst path is short and resting areas exist. | Comparing several candidate current speeds. |
| Strong | Above 2.0 | Speed margin is comfortable for a short burst, assuming oxygen is adequate. | Screening likely passable microhabitats or short jets. |
| Scenario | Suggested duration | Intensity | Calculation caution |
|---|---|---|---|
| Startle escape | 1 to 3 seconds | Startle maximum | Peak speed is brief; distance may be overestimated if turns are sharp. |
| Predator chase | 2 to 6 seconds | Full burst | Use morphology and fatigue adjustments for repeated chases. |
| Fishway passage | 4 to 12 seconds | Controlled sprint | Compare net distance with the length of the high-velocity zone. |
| Flume trial | 5 to 20 seconds | Conservative burst | Lab speeds depend on acclimation, handling, and test protocol. |
| Angling sprint | 3 to 10 seconds | Full burst | Hooked fish speed may be limited by fatigue and line angle. |
✅ Practical calculation tips
When a fish is hooked it suddenly speed up. Anaerobic energy are stored in white muscle fibers for raw power. They push the tail hard but soon fatigue. To capture fish (or build fishways) you need to tell difference between cruising and sprinting. If you put in length along with other environmental factors, then the calculator do the work.
Enter your fork length (it’s more consistent than total length). And a 12″ fish isn’t always a 12″ fish. A 12″ bass isn’t the same than a 12″ trout in the same body of water. For that reason, there are baseline speeds built into the tool for both panfish and pike; these species aren’t shaped the same. That’s one thing most folks overlook when applying generalized rules to specific scenarios.
How Fish Swimming Speed Is Calculated
The other side of that equation is the biological part, which can be thought off as being like a throttle controlled by water temperatures. Metabolic reactions slows down and muscles don’t contract as fast. A fish in 50 degree water sprints slower than a fish in warmer water do. Your entry into estimator incorporates a multiplier to account for spring or fall, so don’t overestimate its performance. Because it’s important to predict whether or not a fish can get around a barrier, you need to take into account the condition factor that will indicate whether the fish is healthy or not. If the fish is tired they won’t be able to tap into their energy reserves very wellly.
A burst also travels some distance, but it is impeded by drag. A sleek body cuts through the water easily; a hunk of flesh resist movement. Drag is changed by shape setting. A tuna isn’t moving like a catfish. And then there’s turbulence, which complicates things. Rough flow makes the fish fight more, burning up energy quickly and reducing distance covered in a sprint. That’s why you compare net advancement against current, not raw speed.
It offers four outputs. The body-length rate allow for relative size comparisons. Water-relative speed show still-water capabilities. Current margin shows whether passage is possible. Burst distance show how far it can go in one short burst. Negative or little net progress mean that no matter what the maximum speed, there’s no crossing. A reference table links margins to results like whether passage is workable or blocked.
Speed isn’t the only factor in burst. Burst is a balance between time, power, and conditions to produce a result. Knowing the boundaries improves your decision making ability for both evaluating habitat and angling. By including physical characteristics along with constraining factors it offers a reasonably accurate image of a situation. There is no substitute for direct measurement or on-site observations. Knowing what top-end effort might of be is an asset to reading water behavior.