Fish Energy Expenditure by Current Calculator
Estimate the metabolic energy a fish spends holding position or swimming against current using fish size, species physiology, water temperature, turbulence, and exposure time.
📌 Current energy presets
⚙ Fish, flow, and exposure inputs
Energy expenditure estimate
Calculation breakdown
🔬 Live model summary
Velocity divided by fish fork length.
Metabolism modifier from water temperature.
Share of practical sustained capacity.
Approximate metabolic power by fish mass.
📊 Comparison grid
Resting refuge
Low energy if current falls below 0.5 BL/s.
Feeding lane
Moderate cost can be offset by food intake.
Migration push
Sustained movement needs resting pockets.
Burst or fight
Short exposure only when BL/s is high.
🐟 Species data used by the calculator
| Species group | Routine MO2 | Optimum temp | Flow efficiency |
|---|---|---|---|
| Trout / char | 150-230 mg O2/kg/hr | 50-59°F / 10-15°C | Good in cool riffles, high oxygen demand in warm water |
| Bass / sunfish | 120-200 mg O2/kg/hr | 68-78°F / 20-26°C | Efficient at moderate current, poor in prolonged heavy flow |
| Salmon / steelhead | 170-280 mg O2/kg/hr | 46-58°F / 8-14°C | Strong migratory swimming with high aerobic capacity |
| Walleye / perch | 110-190 mg O2/kg/hr | 55-66°F / 13-19°C | Moderate efficiency, often uses breaks near bottom structure |
| Redfish / drum | 130-230 mg O2/kg/hr | 72-82°F / 22-28°C | Handles tidal flow well when temperature and oxygen are favorable |
| Carp / buffalo | 90-170 mg O2/kg/hr | 70-82°F / 21-28°C | Lower routine demand, deeper body raises cost at faster current |
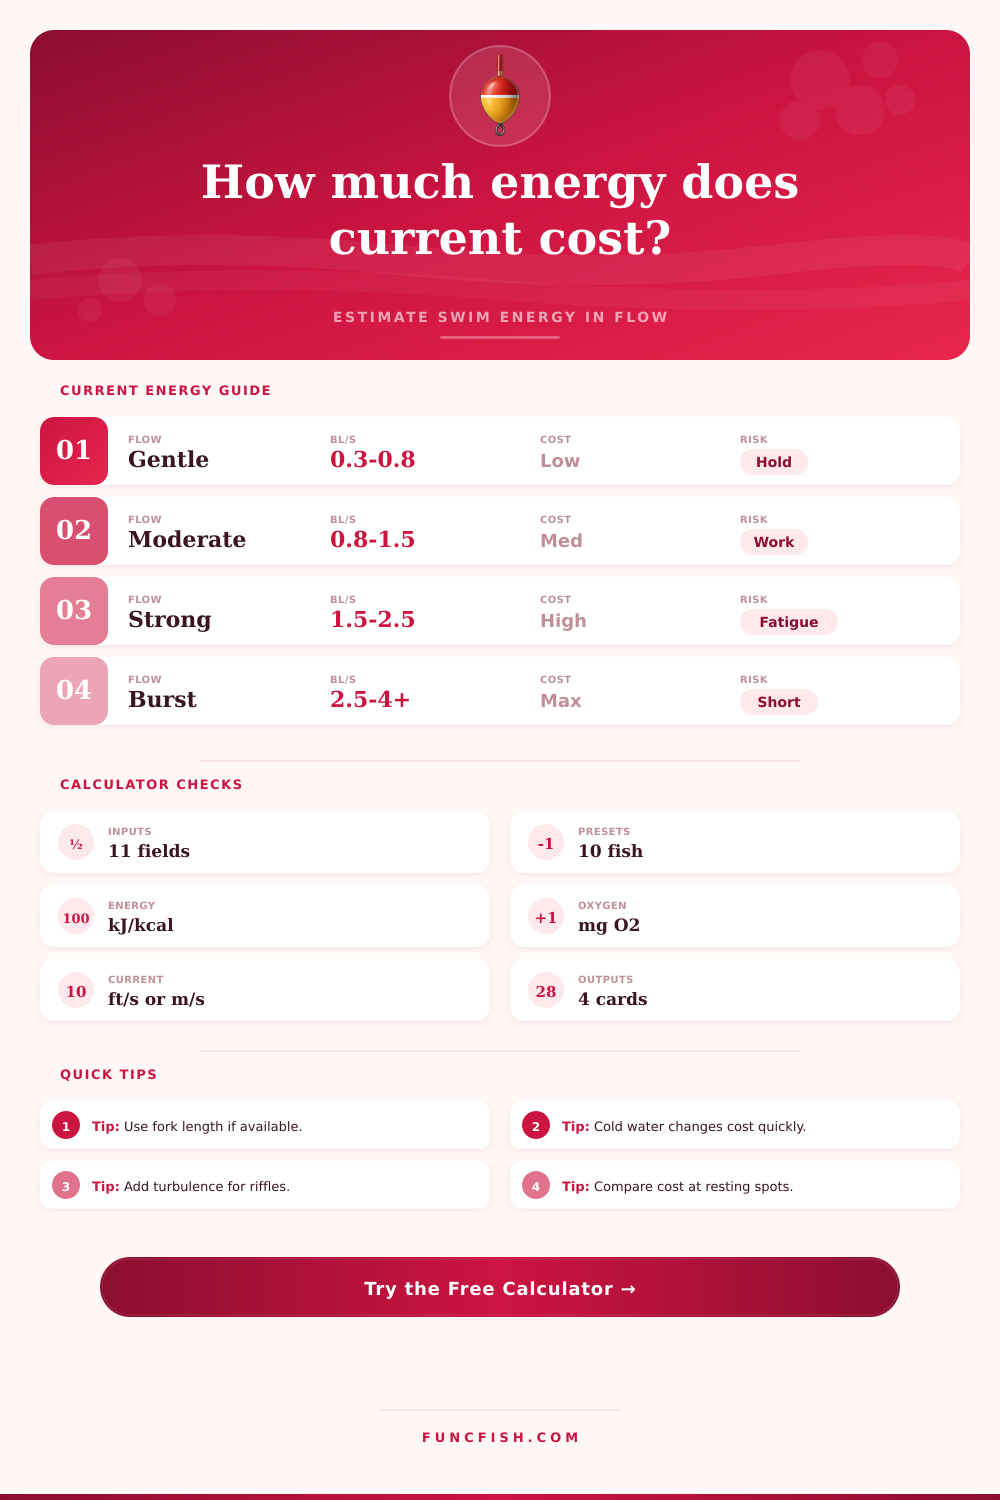
| Current class | Body lengths per second | Energy pattern | Field interpretation |
|---|---|---|---|
| Refuge or slack edge | 0.1-0.5 BL/s | Near routine metabolism | Usually sustainable for long holding periods if oxygen is adequate |
| Feeding seam | 0.5-1.2 BL/s | Routine plus moderate swim cost | Good tradeoff if drift food, cover, or station holding are available |
| Fast run | 1.2-2.2 BL/s | Steeply rising oxygen demand | Useful for short travel, but resting pockets matter quickly |
| Barrier jet | 2.2-3.5 BL/s | Near sustained capacity | Passage depends on distance, turbulence, and fish condition |
| Burst zone | 3.5+ BL/s | Brief anaerobic contribution | Do not treat as a repeatable long-duration swimming rate |
| Exposure duration | Recommended model use | Fatigue check | Useful output |
|---|---|---|---|
| Under 2 minutes | Burst or passage screen | Watch turbulence and repeated attempts | Total kJ and cost grade |
| 2-15 minutes | Short run, chase, or tailrace hold | Scope use above 70% is a warning | MO2 rate and oxygen per kg |
| 15-60 minutes | Feeding lane or migration segment | Resting pockets should be included | Duty-cycle adjusted energy |
| 1-6 hours | Habitat holding comparison | Use average current at fish depth | Energy per fish mass |
| Over 6 hours | Daily energy budget scenario | Food intake and oxygen availability dominate | kcal plus oxygen demand |
| Adjustment | Low setting | High setting | How it changes results |
|---|---|---|---|
| Temperature | Near optimum | Cold or warm stress | Raises maintenance cost and reduces useful swim margin |
| Turbulence | Smooth laminar flow | Broken riffles or wakes | Adds correction cost and reduces effective efficiency |
| Duty cycle | Resting or cover use | Continuous swimming | Scales active swim cost while keeping routine metabolism present |
| Condition factor | Thin or stressed fish | Healthy robust fish | Changes the cost of meeting the same current challenge |
💡 Practical calculation tips
Standing in a river in heavy, water-logged waders is one thing; understanding why a fish won’t hold onto cover despite facing same current is another. Much of this boils down to energy budget. Fish do not simply sit in water; they are active swimmers constantly balancing laws of fluid dynamics, water temperatures, and limitations of their bodies. To estimate how much energy a trout use to stay in place against a current is to measure the cost of staying alive against the benefit of finding food.
After inputting an estimate of current speed, water temperature, and fish length, the calculator does all the work. See the example above. You don’t have to guess at unit conversions or coefficients. It turns raw velocity into body lengths per second. This is a standardized metric that lets you compare a huge river salmon with a tiny brook trout. And that’s important because a 10-foot-per-second current might be a gentle breeze for a three-foot fish, but it’s a deadly wall for a juvenile six inches long. The tool automatically factors in that kind of scaling. It gives you not just the speed on the surface, but also a realistic look at how much metabolic load the fish is carrying.
Why Fish Choose Where to Stay in the Water
But there’s another factor that multiplies all of this… Water temperature. Metabolism is slowed by cold water, so that sounds good until you remember that muscle power and aerobic scope are also reduced. On the other hand, warm water speeds up reaction time but also robs oxygen stores more quickly. By accounting for each species’ best temperature range, the calculator factors in baseline oxygen demand. Seventy-five degrees may be comfy for a bass, but that same temp would put a trout over the edge. Even if current speed was the same, a trout holding in warm water eats through its energy reserves much faster then a trout holding in cool flow. You want to know that trade-off.
But you also add the penalty of turbulence which smooth laminar models don’t account for at all. Eddies form around bumps and shapes, forcing you to constantly make small corrections to stay on target. Duty cycle and turbulence input takes this into account. Constantly darting in and out of cover reduces effective swim time. But energy cost per second spikes due to acceleration forces, increasing the glycogen burn.
That’s where most folks go wrong. They think the toughest work is continuous steady swimming. It isn’t. Constant start and stop movements, like real river fishing, deplete glycogen stores faster than a long steady run. This is because they use anaerobic bursts to make those quick corrections. The key here is to look at the oxygen demand per kilogram and cost grade of the output. This tells you whether the fish is operating within its sustainable aerobic window or pushing toward fatigue. A lower grade means you can manage the flow better for long-term holding. High grades indicates that exposure should only be brief.
For those of us who stock habitat or plan for a restoration project, this differentiates between life and death. Pushing fish past their aerobic scope results in slower growth rates or abandonment all together. Growth is sacrificed for maintenance, just enough to maintain balance and gill movement. The importance of shelter becomes clear once you start comparing situations. Take a quick run down the main channel and compare that with a nearby eddy. You’ll see a huge difference in terms of energy expended. This is why fish gather near a bank or hang out underneath an overhang even when there is no food available around them. It’s all about physiology and economics.
A simple table found on the page breaks it down and illustrates how minor variations in water velocities can make a habitat either best or prohibitive. These are some dynamics that will completely change your reading of a river. Suddenly, instead of seeing nothing but water running across rock, you see areas with different metabolic costs. An area with a fast run may appear empty of fish because it’s too costly to hold position in without continual feeding opportunities. An area with a slow pool may be loaded because it’s inexpensive to conserve energy there. What you observe on the surface makes more sense when put into context based off the numbers.
Respecting those biological limitations is ultimately key to both fishery management and your own fishing success. It’s a complicated equation, where the fish calculates how much energy it takes in compared to how much energy it uses. It calculates how much energy it spends before deciding where to go. When you estimate cost yourself, you begin to understand why it is there and what makes it go away. You can start reading water less for visibility and more for viability.