Harvestable Size Timing Calculator
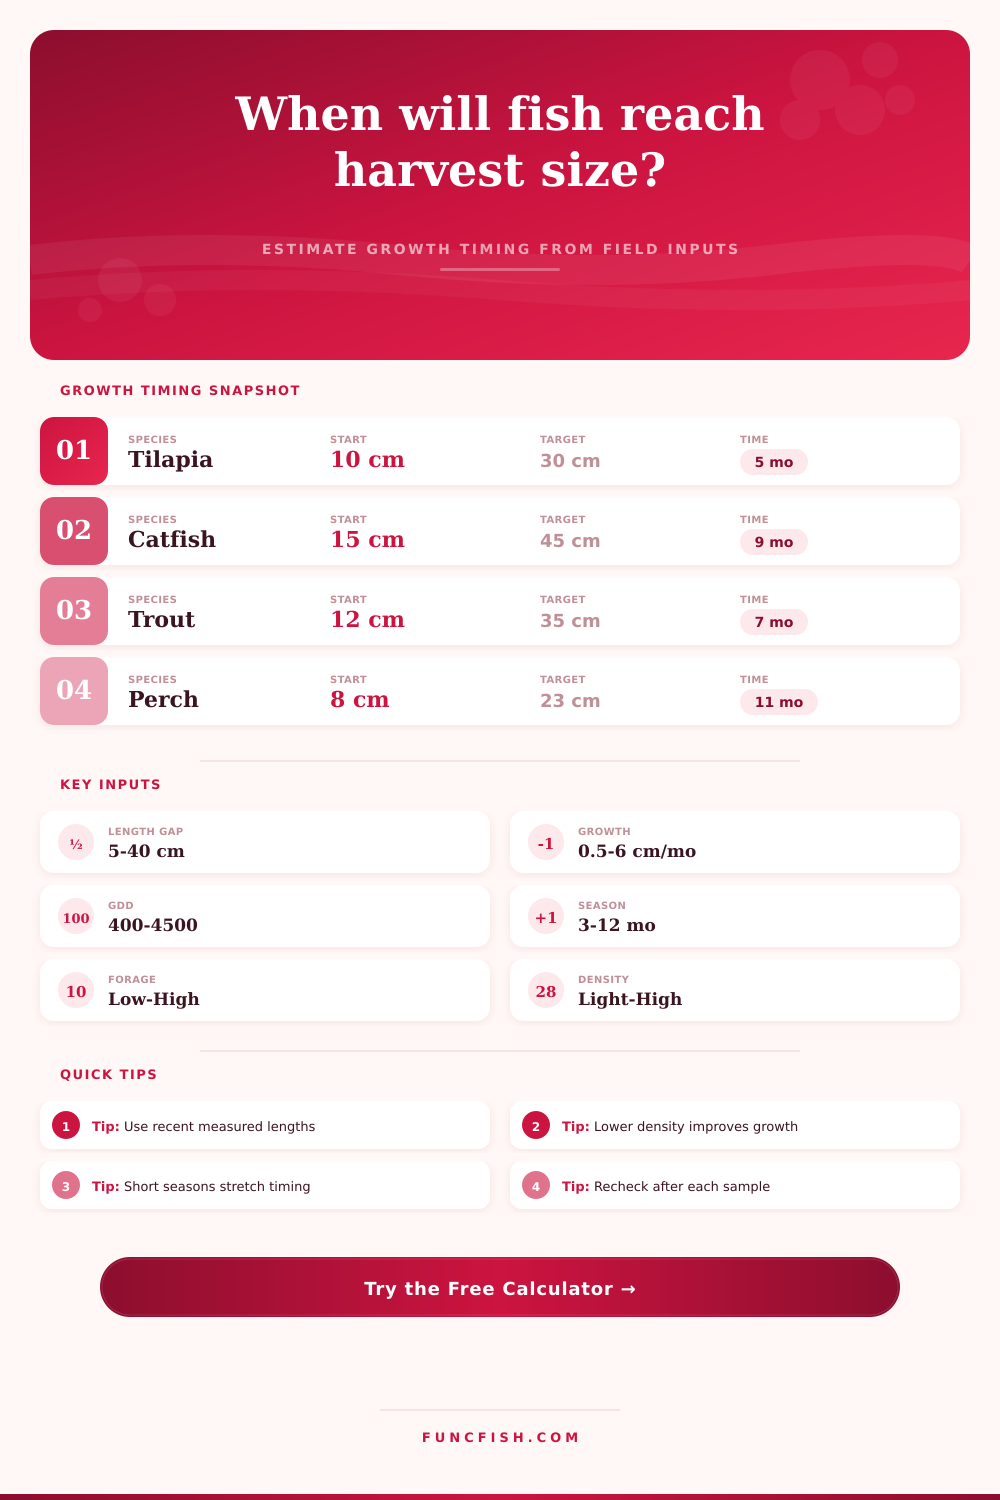
Estimate how long a fish cohort may need to reach a user-entered harvestable length from current size, growth rate, thermal units, season length, forage, density, and age class.
📌Scenario presets
⚙Growth timing inputs
Growth timing forecast
Full breakdown
📋Species comparison grid
Nile tilapia
Channel catfish
Rainbow trout
Largemouth bass
Walleye
Yellow perch
Atlantic salmon
Hybrid striped bass
📈Growth factor reference tables
| Age class | Multiplier | Common use | Planning note |
|---|---|---|---|
| Fry / early juvenile | 1.35 | Rapid early length gain | Highly sensitive to feed and temperature |
| Fingerling | 1.18 | Nursery or newly stocked fish | Often the fastest practical planning phase |
| Juvenile grow-out | 1.00 | Baseline growth forecast | Best default when age is uncertain |
| Subadult | 0.76 | Near harvest cohorts | Length gain slows as body mass rises |
| Older slow-growth fish | 0.55 | Retained or mature fish | Use with conservative timing expectations |
| GDD fit | Thermal factor | When it appears | Timing effect |
|---|---|---|---|
| Under 45% of species need | 0.55 | Short or cool season | Growth estimate stretches sharply |
| 45% to 70% | 0.72 | Patchy warm periods | Expect a long tail to target size |
| 70% to 95% | 0.90 | Normal growing season | Useful for average planning |
| 95% to 120% | 1.04 | Strong thermal season | Good support for active growth |
| Above 120% | 1.12 | Warm extended season | Extra heat helps only up to the cap |
| Forage level | Forage factor | Typical signal | Forecast use |
|---|---|---|---|
| Poor forage | 0.62 | Thin bodies, weak condition | Use a cautious growth window |
| Limited forage | 0.78 | Some feed gaps | Slower than species average |
| Steady forage | 1.00 | Regular ration or natural food | Baseline forecast setting |
| Rich forage | 1.16 | Full bodies, strong prey base | Shortens active-month estimate |
| Intensive feed | 1.28 | Managed feeding program | Fast end of practical estimate |
| Density pressure | Density factor | Common signal | Timing effect |
|---|---|---|---|
| Light density | 1.12 | Low competition | Can improve realized growth |
| Moderate density | 1.00 | Balanced carrying capacity | Baseline planning setting |
| Crowded | 0.82 | Uneven size spread | Use a wider timing range |
| High pressure | 0.64 | Strong competition or stress | Often delays target length |
🔎Planning examples
| Scenario | Current to target | Season inputs | Expected timing pattern |
|---|---|---|---|
| Warm tilapia pond | 10 to 30 cm | Long season, rich forage | Often fits one strong grow-out season |
| Cool trout raceway | 12 to 35 cm | Cool water, steady feed | Usually steady with moderate calendar stretch |
| Crowded bass pond | 15 to 30 cm | High density, limited forage | Target may push into the next season |
| Perch tank group | 8 to 23 cm | Short season, steady feed | Smaller monthly gains need close resampling |
💡Calculation tips
Tip: Recalculate after every length sample. Even a small change in measured monthly growth can move the estimated calendar date more than a forage setting.
Tip: Use this as a biological planning estimate for size timing only. It does not interpret harvest rules, seasons, bag limits, permits, or local management requirements.
So what do you do when you think they’re big enough to keep, but you don’t know? Everyone’s been there before. The fish is a potential keeper; the tilapia is looking good for the tank.
But pull it out too early and you lose weight. Pull it out too late and the fish might grows slowly or even become stunted if they are all packed together in pond. The duration from hope to harvest is measured in time. It is less guesswork to manage visible variables over time then it is to estimate them.
How to Use the Fish Growth Calculator
You input your measured lengths and environmental conditions, then the calculator do all the math for you (above). It eliminates the guesswork associated with growth multipliers and other thermal factor. And it reduces the messy nature of aquaculture to a timeline. That’s where the real value exists, you’re no longer guessing at a date, but rather diagnosing health of your system.
First, there is length difference. It is obvious, right? But folks seriously underestimate impact of distance from target compared to size. Two inches on a four inch fish is huge. Two inches on a twenty-four inch fish are nothing. So that’s what the tool does… it takes into account the remaining distance and divides it by new growth rate. Even though the calendar says they’re supposed to be done, small fish has a long ways to go biologically.
But then there are those thermal units. Fish are cold-blooded engines. Their fuel is burned by water temperature, not that outside air. So if your region has fewer than required heat units, growth clock slows. Not lazy fish; it’s lazy water. And the table on the page indicate just how sharply this can stretch the timeline. Trying to grow warm-water species in a cool climate? You’re fighting physics. Acknowledge the deficit, or your harvest date will be a dream.
The silent killer is density. Great feed, great water, but packed pond? Growth estimates will get hit by penalty of competition for each calorie of feed. Stress result in less efficient feed conversion and that’s factored into the calculator. Perhaps you’re thinking you’re feeding them enough, but the fish just can’t handle it. Sometimes lowering your density is the only solution that would of got back the lost time. It is expensive on space, but it buys back months of growth.
The other side of that equation is feed quality. A good diet (or a heavy feeding program) pushes that growth curve upward. Bad conditions pull it down. That’s why you shouldn’t put all your eggs in one basket: never rely solely on one measurement.
Whenever you have another month to recheck your sample, do so. Immediately, the timeline gets extended if the growth rate slows. But you need to give the tool the new data and it will update it dynamically. Stale inputs equal stale predictions.
Size does matter. And age class matters more then most realize. Because fry weigh less, they don’t have much weight to carry around so they grow rapidy. When a fish matures, it becomes heavy and expends exponentially more energy to transport its own weight. By using factors on age classes, the calculator accounts for this. Even within the same water body, a fingerling doesn’t grows like a subadult fish. Don’t get frustrated. It’s OK to slow down. Slowdown isn’t failure, it’s biology.
There’s a hard boundary that determines how long growing season will be: the season itself. No matter what you feed it, it doesn’t get any longer if your actual growing window is brief. Work with what you’ve got; plan for the thermal season available to you. Plan to succeed, or plan to carry over your stockpile.
And last, examine the confidence interval. That’s what’s telling you that you can rely on this estimate. Tightly estimated things has good sample data. Broad ones come from rough eyeballing. Admit to yourself if it was good or bad. A guess is a guide, not a deadline.
This is a dance with Mother Nature. You set up the right conditions, the fish pay you back in the form of growth. The calculator will provide the language to join in that dance. It shows you the tradeoffs. You’ll look at the numbers and when they agree, you reach out for the net. When they don’t agree, you tinker some more. And that’s how you turn a pond into a production line.