Fish Seasonal Migration Distance Calculator
Estimate seasonal fish migration route distance, active travel pace, round-trip movement, and arrival confidence from species behavior, route geometry, water temperature, flow, barriers, and migration window.
🧭 Migration planning labels
🎯 Quick migration presets
⚙ Route and condition inputs
Seasonal migration estimate
Calculation breakdown
📊 Species migration grid
📘 Migration reference tables
Species movement reference
| Species | Typical seasonal move | Comfort temperature | Usual pace |
|---|---|---|---|
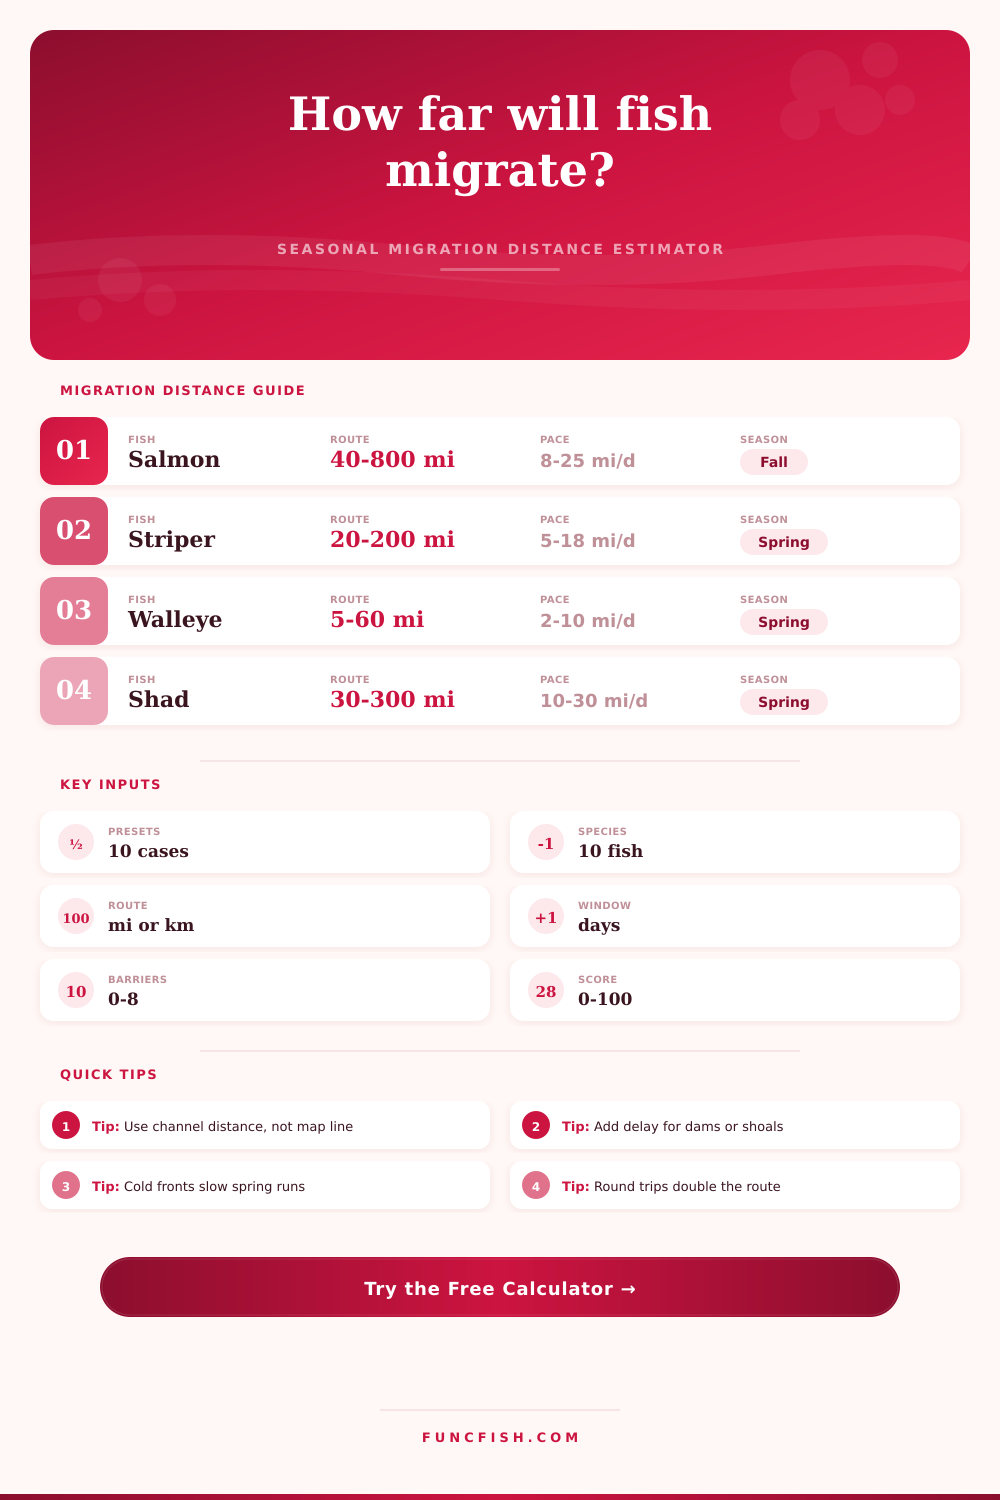
| Chinook salmon | 40 to 800 mi river run | 48 to 58 F | 8 to 25 mi/day |
| Striped bass | 20 to 200 mi coastal or river run | 55 to 68 F | 5 to 18 mi/day |
| Walleye | 5 to 60 mi river or shoal move | 42 to 54 F | 2 to 10 mi/day |
| American shad | 30 to 300 mi anadromous run | 55 to 68 F | 10 to 30 mi/day |
| Lake trout | 3 to 45 mi depth or reef shift | 42 to 52 F | 1 to 6 mi/day |
| Tarpon | 40 to 500 mi coastal loop | 72 to 84 F | 8 to 35 mi/day |
Route multiplier guide
| Corridor | Typical multiplier | When to raise it | When to lower it |
|---|---|---|---|
| River mainstem | 1.10 to 1.60 | Meanders, side channels, low water | Confined valley or mapped river miles |
| Braided river or delta | 1.30 to 2.20 | Split channels, shifting bars | Tracked through main thalweg |
| Large lake shoreline | 1.05 to 1.35 | Island chains or bay detours | Open-water crossing is known |
| Reservoir chain | 1.20 to 1.80 | Drawdown, dams, creek arms | Fish stay in main basin |
| Estuary or coast | 1.05 to 1.45 | Tides, shoals, bay mouths | Direct shelf corridor |
| Wetland floodplain | 1.25 to 2.10 | Backwater access, grass flats | Single ditch or creek route |
Season trigger interpretation
| Objective | Strong cue | Distance effect | Timing risk |
|---|---|---|---|
| Spawning run upstream | Rising temp with usable flow | Longer, directed movement | Barriers and cold snaps |
| Lake or shoal spawning | Stable near-spawn temperature | Shorter but concentrated | Wind exposure and fronts |
| Forage tracking movement | Bait concentration shifts | Can stage in several jumps | Prey scatter or turnover |
| Thermal refuge shift | Temperature leaves comfort band | Depth and latitude driven | Rapid warming or cooling |
| Overwintering relocation | Cooling and stable deep water | Moderate, slower pace | Ice, low oxygen, drawdown |
| Coastal seasonal loop | Temperature front or photoperiod | Often long and fast | Storms and salinity fronts |
Pace and confidence bands
| Rating | Score band | What it usually means | Field check |
|---|---|---|---|
| Strong arrival odds | 78 to 100 | Pace fits species and cues are aligned | Watch first choke points and warming banks |
| Workable migration | 60 to 77 | Distance is plausible with some delays | Expect staggered waves or resting reaches |
| Delayed or partial | 42 to 59 | Run may be late, split, or held up | Check barriers, temperature edges, and flow |
| Low confidence | 0 to 41 | Window, route, or conditions are mismatched | Shorten route or wait for stronger cues |
💡 Migration calculation tips
Use route distance carefully. If you start from a map line, multiply for bends, shore-following, side channels, bay mouths, and holding reaches. If you already have river miles, keep sinuosity close to 1.00.
Treat the score as a planning signal. A low score does not mean no fish move; it means the entered distance, window, water temperature, flow, barriers, and species pace do not line up cleanly.
A great example would be viewing a river bank in early spring. It can make you think there’s nothing swimming around. Fish aren’t missing. They’re displaced. This movement in fisheries are expected, but also quite maddening because you rarely see it happen and when it does happen, it’s usually over great distances and under surface.
So we have to begin to consider more than the biological aspect of their move. We need to examine the logistical aspects too. How far do these fish travel? How quickly will they get there? What impedes them? It’s all about degrees of change, miles and the bodily limitations of each species.
How to Predict Fish Movement
It’s a bit of reverse engineering, but page has a calculator that will do the math for you: It’ll spit out an estimate of how far your fish are from spawning ground and tell you how confident you can be in their arrival date. And if you want to use this tool effectivey, you must learn to think like hydrologist.
The biggest error anglers commit is measuring straight-line distance (as the crow flies). Fish don’t fly (they’re in the channel). On a map with a straight line running twenty miles to the spawning ground, the true distance the fish has to travel may actualy be thirty or even forty miles. This is when you factor in the bends in the river, those side channels, and all the winding around until they find path of least resistance. That’s where the winding factor comes into play. It closes the gap between GPS coordinates and what you’ll see in the water.
That movement depend on temperature. Because fish are cold blooded, they is driven by the environment; specifically the water’s temperature. A cold front can literally stop a migration in its tracks and suspend school in the middle of the river until water temperatures warm again. That’s where the tool comes into play… It factors in current water temperature relative to fish’s comfortable range. When the water gets too cold, the fish lack the fuel needed to push upstream. And when it’s too warm, they might find deeper holes providing thermal shelter instead of pushing forward with their journey. It is not just about how far you are calculating but whether the fish has the physical ability to cover that distance at that time.
On the flipside, barriers like dams, low-head weirs and even shallow shoals can break up a migration route and cause fish to take a rest, skip around, or give up altogether. The calculator feature a passability rating that factors into overall confidence score. So a high score doesn’t mean you will get bit, but means the fish are lining up for a move. And if your score is low then chances are they’re sitting back there somewhere behind a dam or just waiting on water level change. It’s a feasibility rating, not a prophecy.
This timing also matters. A thirty-day window differ greatly from a three-day migration window. This means there is an active pace required each day, and the tool breaks that down. So if it tells me the fish has to swim twenty miles a day to reach their destination by a certain time, do I know if they are even able to swim that fast? Some species can keep up brutal speeds, like salmon, while others is slower, like walleyes. Knowing the limits of the species will help you avoid sitting there waiting on fish that won’t make it within your remaining time frame.
To set your expectations, the reference table on the page depicts typical seasonal moves, and comfort temperatures of common species. From chasing tarpon around a coastal loop, to walleye moving to a river shoal, the strategy is different than before. One requires reading the tide and the front; the other requires reading the flow and the temperature trend. One requires reading the tide and the front; the other requires reading the flow and the temperature trend.
It’s all about reading the signs before they arrive and planning for the fish migration. You must understand that it’s a traveler and has only so much time and energy in its travel budget. And when you put together the physical barriers, the thermal cues and the route geometry, you have a clearer picture based off where to expect the action. No more guessing, just anticipation.
The river isn’t random, it’s a highway and there are traffic rules. Once you learn to read the signs, the empty water begins to look full again.