Fish Oxygen Preference Zone Calculator
Compare measured dissolved oxygen with species comfort ranges, water temperature, altitude, salinity, depth, and activity to judge whether a fishing zone is preferred, marginal, or stressful.
📍Field presets
⚙Oxygen zone inputs
Oxygen preference forecast
Formula breakdown
🧪Gear and species comparison grid
Coldwater Salmonids
Bass Weedlines
Walleye Breaks
Warm Ponds
Tidal Channels
Ice Cover
Aerated Tanks
Bloom Water
📊Species oxygen reference
| Species group | Stress floor | Preferred DO | Preferred temperature | Typical oxygen behavior |
|---|---|---|---|---|
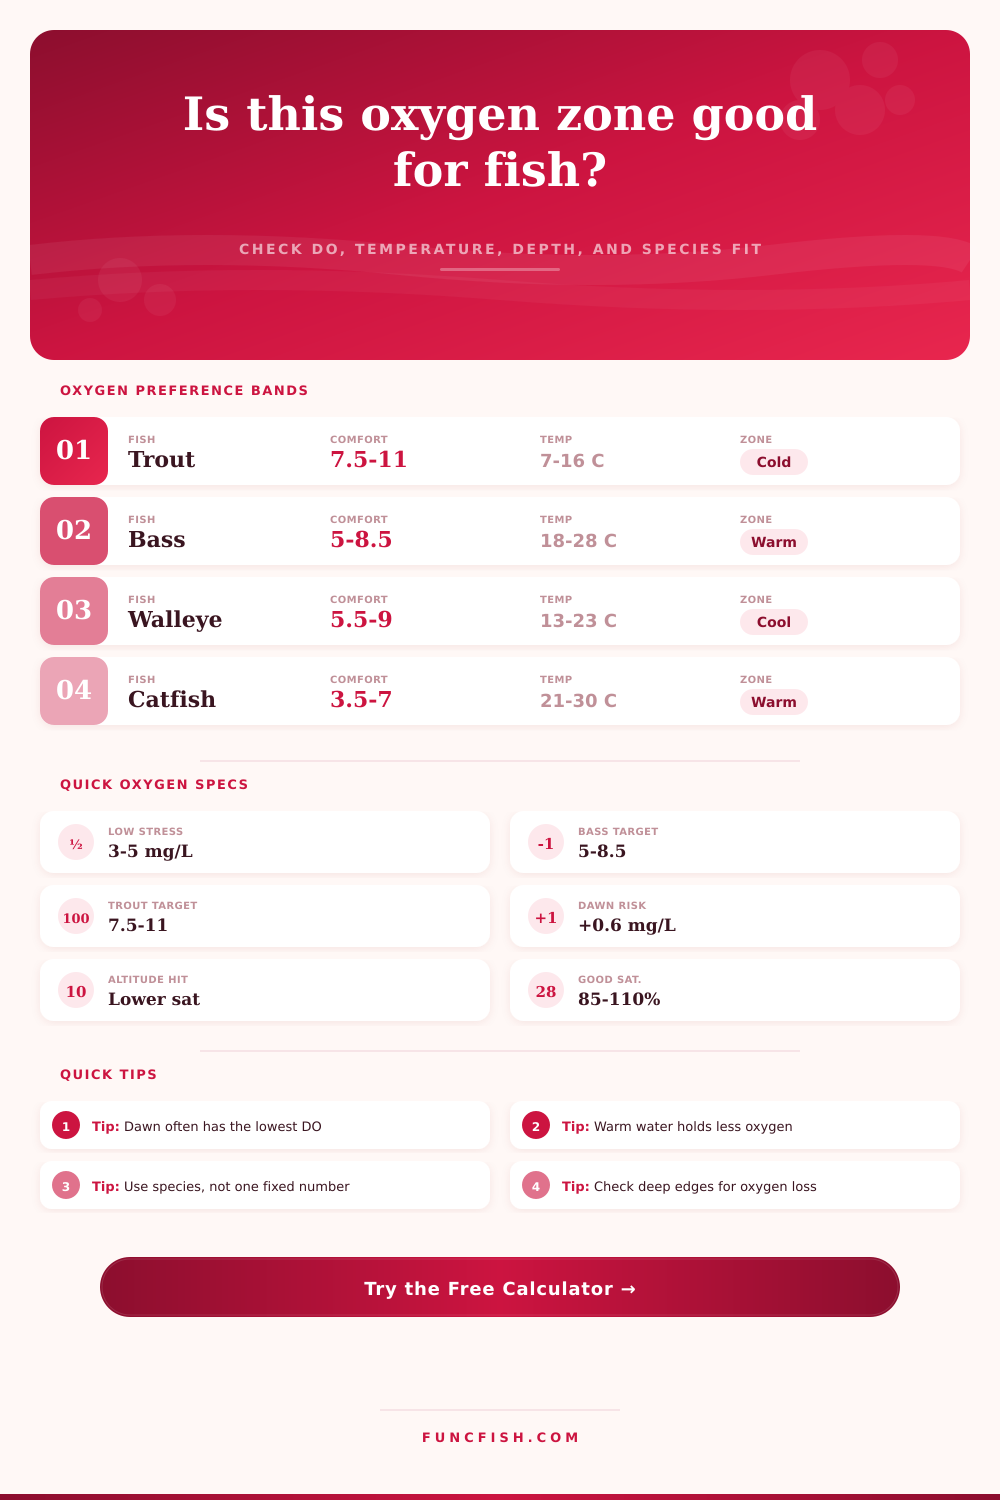
| Brook trout | 6.5 mg/L | 8.0-11.5 mg/L | 45-60 F / 7-16 C | Leaves warm, weakly mixed water early |
| Rainbow trout | 6.0 mg/L | 7.5-11.0 mg/L | 48-64 F / 9-18 C | Needs cool water with steady saturation |
| Chinook salmon | 6.5 mg/L | 8.0-12.0 mg/L | 46-58 F / 8-14 C | High demand during migration |
| Walleye | 4.2 mg/L | 5.5-9.0 mg/L | 55-73 F / 13-23 C | Uses cool breaks near bait and oxygen |
| Largemouth bass | 3.5 mg/L | 5.0-8.5 mg/L | 65-82 F / 18-28 C | Tolerant but avoids severe dawn lows |
| Smallmouth bass | 4.0 mg/L | 5.5-9.0 mg/L | 60-75 F / 16-24 C | Favors rock, current, and cool oxygen |
| Striped bass | 5.0 mg/L | 6.0-9.5 mg/L | 60-72 F / 16-22 C | Often pins to oxygenated bait zones |
| Channel catfish | 2.5 mg/L | 3.5-7.0 mg/L | 70-86 F / 21-30 C | Tolerates lower DO than many gamefish |
🌡Temperature saturation guide
| Water temperature | Freshwater saturation at sea level | Warmwater interpretation | Coldwater interpretation |
|---|---|---|---|
| 40 F / 4 C | 12.8 mg/L | Usually ample if mixed | Excellent holding oxygen |
| 50 F / 10 C | 11.3 mg/L | High ceiling for bass and panfish | Strong trout and salmon range |
| 60 F / 16 C | 10.0 mg/L | Comfortable with normal mixing | Still suitable for many trout |
| 70 F / 21 C | 8.9 mg/L | Good if morning DO stays stable | Often warm for trout stress |
| 80 F / 27 C | 7.9 mg/L | Watch dawn lows and weed mats | Too warm for most salmonids |
| 90 F / 32 C | 7.3 mg/L | Low ceiling, high demand | Avoid for coldwater species |
🌊Setting and depth risk table
| Water setting | Typical oxygen pattern | Depth drop used | Best reading window |
|---|---|---|---|
| Cold river run | High mixing and low daily swing | 0.03 mg/L per m | Any time, plus temperature check |
| Tailwater | Can change below dams | 0.08 mg/L per m | Before and after release shifts |
| Clear lake shelf | Stable near surface, lower below breaks | 0.12 mg/L per m | Morning and afternoon comparison |
| Weedy lake edge | High afternoon, low near dawn | 0.18 mg/L per m | Pre-dawn for worst-case check |
| Farm pond | Large night draw in summer | 0.20 mg/L per m | Just before sunrise |
| Tidal estuary | Salt and tide control saturation | 0.10 mg/L per m | Compare incoming and outgoing tide |
| Reservoir thermocline | Sharp drops below productive layer | 0.26 mg/L per m | Profile by depth |
| Ice cover pocket | Slow oxygen loss under snow or decay | 0.16 mg/L per m | Midday and late season |
🔧Measurement method table
| Method | Typical precision | Field strength | Calculator allowance |
|---|---|---|---|
| Optical DO meter | About 0.1-0.2 mg/L | Fast profiles, low maintenance | 0.20 mg/L |
| Galvanic DO probe | About 0.2-0.4 mg/L | Good portable readings | 0.35 mg/L |
| Polarographic probe | About 0.2-0.4 mg/L | Reliable after warm-up | 0.35 mg/L |
| Winkler titration | About 0.1-0.2 mg/L | Strong lab-style reference | 0.15 mg/L |
| Color disk kit | About 0.5-1.0 mg/L | Useful quick field estimate | 0.75 mg/L |
| Glass ampoule kit | About 0.3-0.6 mg/L | Simple spot sample | 0.45 mg/L |
| Continuous logger | About 0.1-0.3 mg/L | Best for dawn swings | 0.25 mg/L |
| Low range test strip | About 1.0-2.0 mg/L | Screening only | 1.25 mg/L |
💡Oxygen calculation tips
Tip: A single afternoon oxygen reading can overrate weedy shallows. Dawn readings show the low point after plants and algae respire all night.
Tip: Temperature matters twice: warm water holds less oxygen and many fish need more oxygen while their metabolism rises.
Oxygen is a key component in fishing success. For most, it’s something we don’t consider. We look at tide charts. We check out structure and follow current breaks. But we rarely look at dissolved oxygen levels.
Does this make the fish stay or go? Here’s an example: There is plenty of bait and perfect cover in the area. There are no fish. The oxygen is too thin.
Why Oxygen Is Important for Fishing
That’s where the calculator comes into play. It makes the invisible visible. It compares measured dissolved oxygen with the range that suits your target species comfort zone. It considers depth, temperature and even type of meter used.
Why? The goal is to shift guesswork to knowledge. It shifts from, “Does this water look good?” to, “Will this water allow me to breathe for my desired species?
The first one is the easiest: Temperature. Simply put, warm water has less dissolved oxygen than cold water. It’s a hard chemical fact. But on the water it makes a big difference. For example, if I’m at 7 milligrams per liter at 80 degrees, it’s a different story then if I were looking at 40 degrees. That’s a thin read at 40 degrees. And that’s often all it takes at 80 degrees for both panfish and bass.
That’s where the magic happens with the tool. Just tell it what type of fish you’re after, and what the water temperature is. Then it figures the rest out for you. No memorizing saturation tables here.
Just know that hot water forces the air out of the water. As the temperature rises, the oxygen ceiling goes down. Fish metabolism speed up in warmer temperatures. So they have to work harder to stay active. And the water doesn’t hold as much oxygen. So they require even more oxygen to maintain activity. That combination is why stagnant pond fishing can get difficult in heat of summer.
But folks forget other factors like altitude and salinity. I have fished some high mountain lakes and they are gorgeous fisheries. The water is clear and inviting. But the fact is that air pressure is less up there, so even if the water temps are low, the water won’t hold nearly as much oxygen. So why might a trout appear stressed? It is not necessarily because the water isn’t clean. Simply because atmosphere doesn’t provide enough gas.
Similarly salt is another factor. If you’re an estuarine angler, you already know what I mean. The inflow of salt decreases oxygen saturation. What may be a good read in a freshwater lake could be borderline in a tidal creek. These variables is important. The calculator asks for them precisely so it can show you a realistic picture. It removes the illusion of a good reading.
There’s one other huge variable: Time of day. Plants do their thing at night. They take up oxygen and give off carbon dioxide. It’s the same with all that algae in the shallows and weeds on that cove. The deepest part of the oxygen depletion typically occur immediately before daylight. A test early in the afternoon could be very deceptive. Photosynthesis may drive a high oxygen level. Darkness falls. The plants begin breathing. Oxygen plummets.
Check your equipment a few seconds prior to first light. Now you’re seeing the true bottom. That’s what tells you whether or not it’ll support fish through the night. Enter sample time into the tool. See where the zone moves throughout the day. Come to appreciate those dark hours.
This also has to do with how you measure it. Meters aren’t all alike. Probes don’t always stay fixed. Test strips aren’t great guesses. These things has some leeway built into the calculator. Use a cheap kit? It gives you a little room for imprecission. It keeps you from over-trusting any shaky number. This is smart engineering. It keeps you honest about your own data. It provides a range instead of false precision.
Dissolved Oxygen is like a tank of fuel. So think of it that way. You got a race track and a fast car. Doesn’t matter how fast your car goes if there’s no gas in the tank. It is the same with fish. They need bait for food. They need structure to hide behind but they also need oxygen to travel around.
So when you factor all this together, depth, species needs, current conditions, etc…you will have a full map of the water column. You don’t waste time casting where the tanks are empty. You learn where the life realy is. Understanding what you’re even looking at is mostly the trick. Then you’ll begin seeing fish once you see the oxygen.