Fish Per Acre Estimate Calculator
Convert sampled catch into a fish-per-acre estimate using sampled area, shoreline effort, gear efficiency, habitat coverage, species group, size class, productivity, and survey confidence.
📌Named survey presets
⚙Survey and density inputs
Count only the target species group and size class included in the estimate.
Use mark-recapture, depletion, or local calibration when available.
Fish density estimate
Calculation breakdown
📊Species and density grid
Black bass
Panfish
Walleye
Catfish
📋Reference tables
| Sampling gear | Typical detection | Best sample basis | Density caution |
|---|---|---|---|
| Boat electrofishing pass | 25% to 65% | Shoreline strip | Shallow cover bias; adult bass and panfish often overrepresented. |
| Backpack electrofishing | 30% to 70% | Wadeable reach | Useful in coves and creeks; escape cover can reduce capture. |
| Experimental gill net | 8% to 35% | Net sets | Size-selective; avoid mixing juveniles with adult density estimates. |
| Fyke or trap net | 10% to 45% | Net nights | Strong for crappie, panfish, and spawning movements. |
| Hoop net series | 12% to 42% | Net nights | Good catfish signal but bait, current, and soak time matter. |
| Beach seine haul | 35% to 80% | Haul area | Best for young fish; misses deep or heavily vegetated margins. |
| Small trawl tow | 18% to 55% | Swept transect | Works for open bottom; poor in snags, rock, and vegetation. |
| Standardized angling sample | 4% to 18% | Effort area | Catchability follows behavior, weather, and angler selection. |
| Species group | Low fish/ac | Management band | High-density flag |
|---|---|---|---|
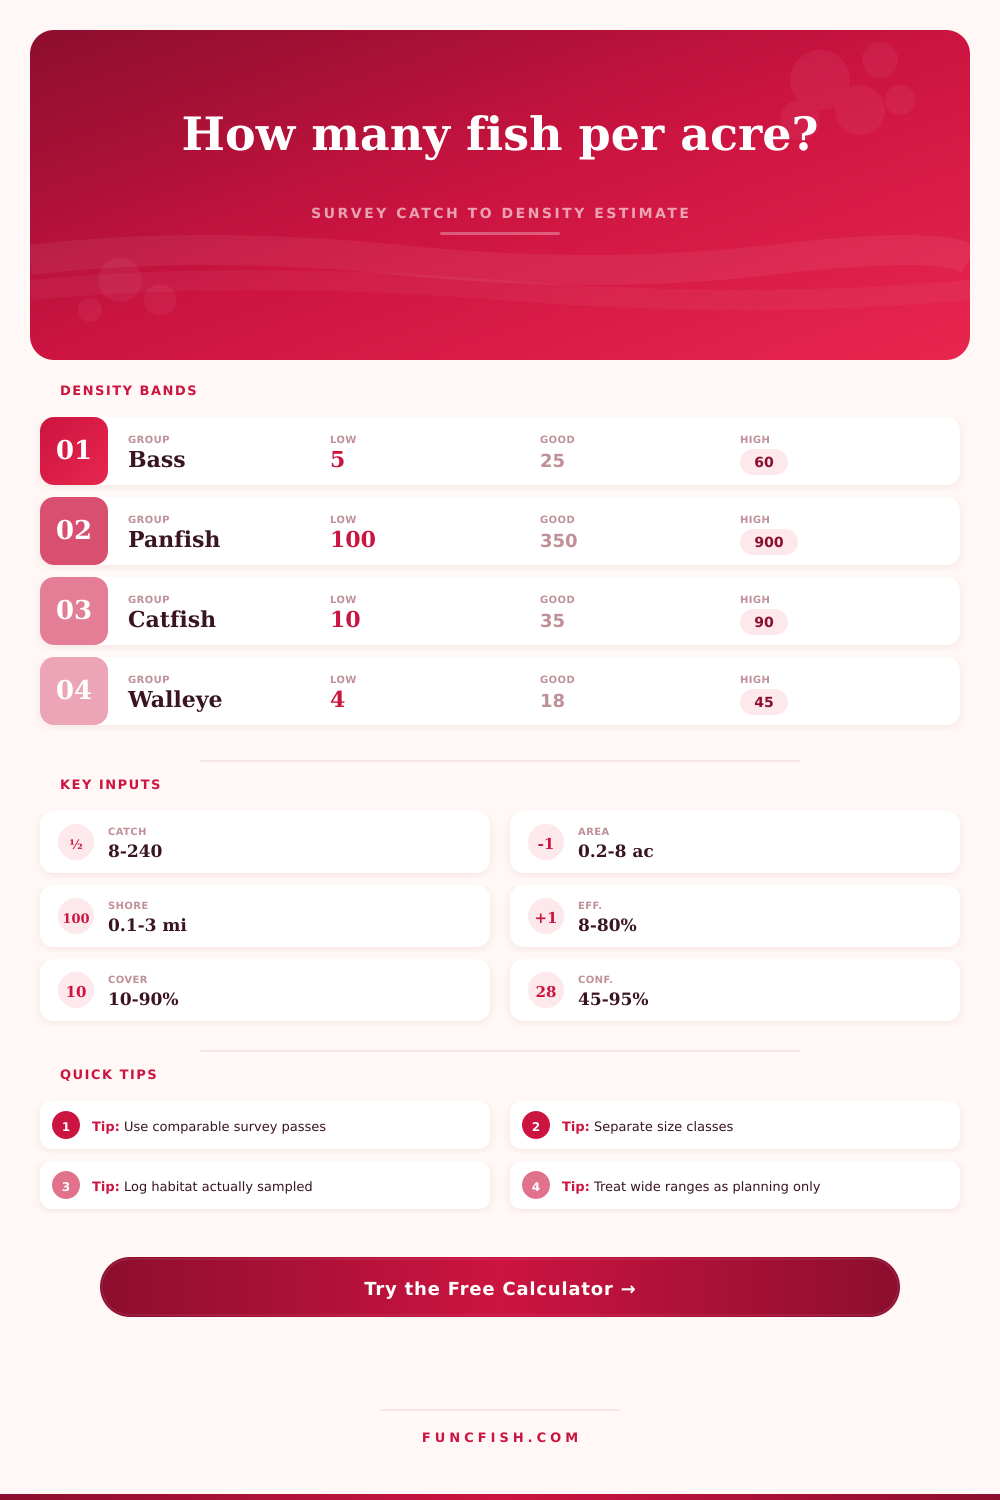
| Black bass | Under 8 | 15 to 45 adult fish/ac | Over 75 can indicate many small fish or strong recruitment. |
| Panfish and sunfish | Under 150 | 250 to 650 fish/ac | Over 1000 often needs size structure review. |
| Crappie | Under 20 | 50 to 180 fish/ac | Over 300 can swing sharply by year class. |
| Walleye or sauger | Under 6 | 12 to 35 fish/ac | Over 55 is strong unless forage is exceptional. |
| Catfish | Under 12 | 25 to 70 fish/ac | Over 110 may mean small sizes dominate. |
| Trout and char | Under 25 | 60 to 180 fish/ac | Over 260 needs temperature and oxygen support. |
| Pike and muskie | Under 1 | 2 to 12 fish/ac | Over 20 is dense for large predators. |
| Carp and suckers | Under 25 | 60 to 250 fish/ac | Over 450 can change water clarity and vegetation. |
| Habitat condition | Coverage input | Sampling warning | Adjustment meaning |
|---|---|---|---|
| Sparse structure | 0% to 15% | Shoreline catch may not represent open water. | Habitat weighting trims edge-biased catch. |
| Patchy cover | 15% to 35% | Sample the cover and adjacent plain separately. | Good default for small reservoirs and ponds. |
| Mixed vegetation | 35% to 60% | Catchability can rise for electrofishing and fall for nets. | Whole-lake density stays closer to sample density. |
| Heavy cover | 60% to 90% | Fish may be present but partly shielded from gear. | Efficiency matters more than footprint size. |
| Open pelagic basin | Under 20% | Shoreline-only surveys can miss roaming schools. | Use species habitat pull to avoid overexpansion. |
| Productivity class | Density multiplier | Confidence effect | Use case |
|---|---|---|---|
| Ultra-clear infertile | 0.55x | Narrows high flag | Cold, clear, low-nutrient lakes. |
| Low fertility | 0.75x | Slightly conservative | Clear ponds with limited forage. |
| Moderate fertility | 1.00x | Baseline | Most balanced ponds and reservoirs. |
| High fertility | 1.25x | Allows higher expected density | Forage-rich warmwater systems. |
| Eutrophic or forage rich | 1.50x | Wide natural variability | Highly productive waters with heavy year classes. |
💡Survey interpretation tips
Tip: Do not merge shoreline electrofishing, gill-net, and seine catches into one density unless each gear has its own efficiency and sampled footprint.
Tip: A fish-per-acre number is strongest when the same size class, season, gear, and habitat mix are repeated over multiple surveys.
If you own a pond, most likely you have an idea how many fish is in your pond. Chances are, you’re wrong.
Most don’t live on surface. Others hide behind lily pads and more hide out in deep water. It’s simple enough to guess how many is in there but it takes some work to estimate. To make that estimation, you must be modest and do the math. You can turn what comes out of a net into a reasonable picture of the entire system.
How to Estimate Fish in Your Pond
For starters, know that you are only catching part of the picture with your equipment. An electrofisher is good for bass; they’ll miss walleyes in deep cover. A beach seine is good for young panfish; they won’t get big ones lurking in snags. Bias exists and if you don’t account for it, your counts will be inaccurate.
All you have to do is enter your catch information into the calculator and it does the math for you. You no longer need to guess at any conversions or coefficients. You’re forced to admit what was actualy captured by your net. Hoop nets catch baited fish. Gill nets is selective according to size. Each one is a different level of detection.
Some tools catch 20% of all fish present in an area, some catch 60%. Your catch rates varies depending on your tool’s efficiency. And unless you account for this efficiency, you’re catching shadows not fish.
Also consider the geometry of your sample. Did you catch all the fish in the pond? No. You caught some fish in a certain area of the pond. That area is the denominator of your density equation. It is length of your sample path and width of the strip of water where you caught them.
So if you have a high catch on a small sample area, does that make it a crowded pond? Or were you simply fishing over a spawning bed and caught them luckly? To know how that local density expand to the whole lake, you need to know how large an area of the lake has usable habitat.
If three fourths of the pond has no vegetation then the fish is probably clustered up in the part of the pond with vegetation. The remaining part of the open water are empty space. The tool use habitat weighting to include this clustering. It doesn’t let you assume the fish are evenly spread throughout. They aren’t. They clump together.
The other part of the equation are productivity. You can have a high density of bass in a very fertile reservoir full of algae but not nearly as many than a very clear pond with no nutrients. You enter your pond’s fertility class into the calculator. Why? This establish the biological limit of the pond.
In a bad lake, a lot of fish in a small area are a red flag. Most often, the fish is either stunted or starving. In a good pond with few fish, that’s a green light and indicates that more fish could grew.
This gives you a density signal once the numbers is processed. At this time, we can use the reference table on the page to compare our results with known bands of healthy populations. You may find yourself in the high range and have too many small fish competing for food. Or you may be in the good range but taking out too many fish.
Your confidence range will let you know how stable that estimate is. If it’s wide, you had a small sample size or weren’t sure of your gear efficiency. It’s better to have a rough estimate with a known margin of error then a precise number built on bad assumptions.
You should of used more gear. The science of fisheries management are more about direction than perfection. It is less about seeing than trending. Are the numbers increasing or decreasing? Is the size structure getting better?
This calculator provide a snapshot in time. It transforms chaos into a data point. You can use this point to make decisions, such as whether to wait and see. Should I limit harvest? Should I introduce predators?
It doesn’t replace a professional survey. But it replaces ignorance.
But the pond doesn’t give a hoot about your spreadsheets. It keeps making life anyway. But if you want to lead your life instead of just reacting to it, get down into the engine. Size up the area. Take the number of fish caught. Honor the equipment. And let the numbers show you what you can’t find time to observe.