Freshwater Lens Depth Calculator
Estimate the depth and stability of a coastal freshwater lens from freshwater head, salinity density contrast, island width, recharge, tide exposure, aquifer material, and pumping stress.
📌Lens scenario presets
⚙Freshwater lens inputs
Freshwater lens estimate
Formula breakdown
🐟Species and habitat comparison
Fresh Bass Pond
Snook Canal Edge
Tarpon Lagoon
Forage Nursery
📊Freshwater lens reference tables
| Density setting | Adjacent salinity | Approx lens ratio | What it means | Fishing-water cue |
|---|---|---|---|---|
| Ocean strength | 32-36 ppt | 37-42 ft per 1 ft head | Classic Ghyben-Herzberg lens | Fresh ponds can overlie saltwater |
| Coastal brackish | 18-30 ppt | 42-70 ft per 1 ft head | Weaker density contrast, broader mix | Transition can be wide and fishable |
| Low brackish bay | 5-18 ppt | 70+ ft per 1 ft head | Density formula overstates clean water | Sample salinity before assuming fresh depth |
| Fresh tidal river | 0-5 ppt | Not a salt lens limit | Flow, seepage, and tide dominate | Use conductivity checks instead |
| Aquifer material | Storage behavior | Interface shape | Common field clue | Calculator effect |
|---|---|---|---|---|
| Fine beach sand | Moderate storage | Cleaner, narrower interface | Slow seep at dune toe | Better clean-lens retention |
| Coarse shell sand | Fast exchange | Wider transition | Rapid tide response in pools | More brackish mixing |
| Porous limestone | High storage with flow paths | Patchy transition | Blue holes and coastal springs | Deep but sensitive to conduits |
| Peat marsh | Shallow perched water | Organic, soft boundary | Dark water over mineral sand | Shallower clean lens |
| Karst conduit | Localized high flow | Irregular and channelized | Sharp salinity change near vents | Higher uncertainty factor |
| Lens stress | Typical driver | Depth response | Salinity response | Field check |
|---|---|---|---|---|
| Recharge surplus | Rainy season, wide dune field | Lens thickens downward | Fresh seep strengthens | Low conductivity after dry weather |
| Pumping stress | Well draw or pond seep loss | Fresh core thins | Salt wedge rises | Rising salinity at dawn samples |
| Tidal overmixing | Spring tides, open cuts | Clean depth may hold, interface widens | Brackish zone expands | Different readings by tide stage |
| Storm overwash | Surge, washover fan, breached berm | Temporary collapse near surface | Sharp salt pulse | Track recovery over several rains |
| Drought drawdown | Low recharge and evaporation | Head drops first, lens follows | Fresh edge retreats inland | Sample farthest inland water first |
| Species or habitat | Useful salinity lane | Fresh lens signal | Good search water | Mismatch warning |
|---|---|---|---|---|
| Largemouth bass | 0-3 ppt | Stable clean lens | Dune ponds and upper canals | Brackish seep above 5 ppt |
| Bluegill and panfish | 0-2 ppt | Fresh surface cap | Vegetated pond margins | Thin lens after drought |
| Juvenile tarpon | 2-18 ppt | Fresh-to-brackish cap | Lagoon mouths and creek bowls | Anoxic stagnant fresh water |
| Snook | 5-22 ppt | Mixing edge | Mangrove canals and bridges | Cold fresh discharge shock |
| Mullet and forage | 1-20 ppt | Soft salinity gradient | Tidal drains and marsh ponds | Overwash salinity spike |
| Sea-run trout edge | 0-10 ppt | Cool fresh seep | Spring-fed coastal outlets | Warm stagnant lens water |
💡Lens calculation checks
Tip: The 40-to-1 rule is a starting point, not a water-quality guarantee. Pumping, tides, coarse sand, and storm overwash can leave a much thicker brackish transition than the clean lens depth suggests.
Tip: For fishing decisions, pair the depth estimate with conductivity or salinity samples at the same tide stage. A stable fresh lens can hold bass and panfish, while the transition edge often concentrates forage.
Looking down into a coastal pond, you are standing along its shoreline. The water is clean; it reflect the blue sky above. Bream or bass should of be OK here, right?
That’s what you think until looking through a clear tube reveals haze near the bottom. That haze is a warning: Saltwater is seeping upward from beneath. You’ve reached the freshwater lens. This is an invisible layer of fresh water hovering atop heavier seawater.
What Is a Freshwater Lens?
Knowing how deep that lens sits indicate whether it supports fishable habitat. It can reveals when a storm surge will flood it with brine.
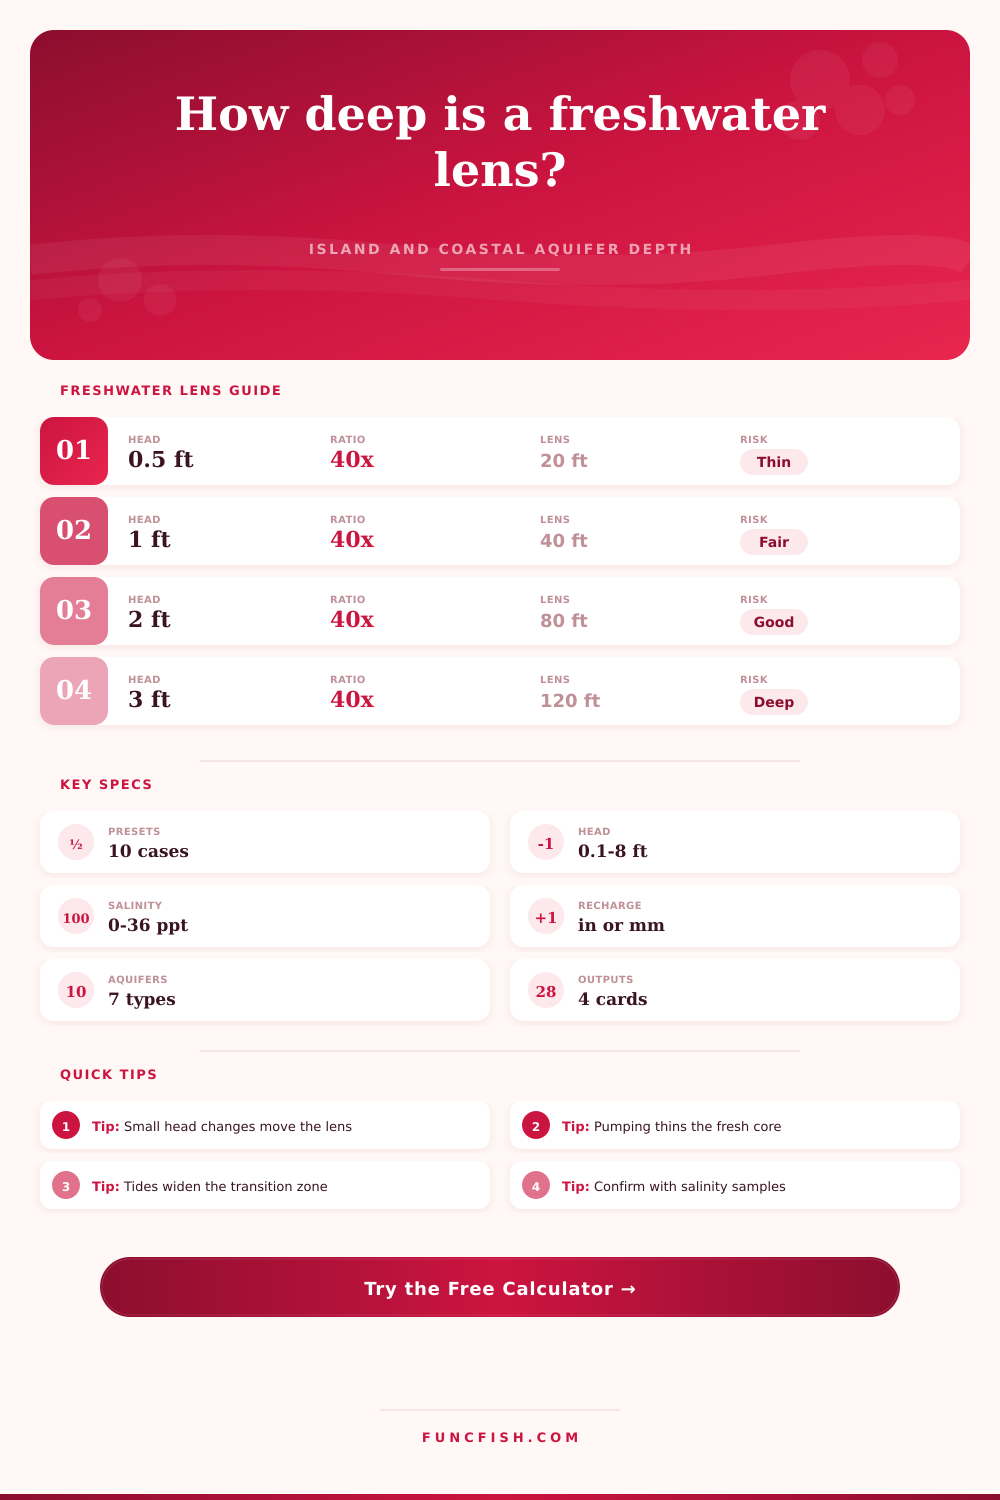
How far down? That’s where the Ghyben-Herzberg principle comes in. It says that for each foot of freshwater above sea level, you’ll have forty feet of fresh below it. It is a handy rule of thumb.
Here’s the thing: nature doesn’t always play nice. The Ghyben-Herzberg principle presumes a static world. The lens isn’t static at all; it expand as rainfall occurs and contracts during pumping activities. When you input local conditions, calculator will do the math for you. You don’t need to guess which coefficients to use based off your shore line.
What kind of material is in the aquifer? Finer materials like fine beach sand create well defined barrier between salt and freshwater. Freshwater floats on top, moving slowely which preserves layering.
When it’s coarse shell hash or fractured limestone, the story change. Seawater mixes into the fresh water because of high permeability. That expand the brackish zone. It is good news if you’re after juvenile tarpon or snook. It is not so good news if you want fresh-water panfish. How the two collide depend on the material.
Lens strength is impacted by stress. Recharge is necessary for lens. Freshwater head increase during a heavy wet season. Increased freshwater push saltwater further out. The fresh core becomes thicker.
During dry seasons, the opposite occur. Rainfall can’t keep up with evaporation, causing the head to decrease. To compensate, salt water moves back to take its place. Pumping from humans speed this process. Fresh core quickly thins out. A deep layer of water in July might not be there by October.
It’s important to monitor when recharge equals draw. And then there are tides.
Sheltered lagoons has a gentle tidal exchange, water stays cleaner with less mixing. Tidal flushing is strong in open cuts. Surge expand the mixing zone. Water quality changes. It is the same spot, with fresh water during low tide. The water is brackish during high tide.
So how do you pin down one depth number? Not easily. It’s a moving target. Transition zone moves. To understand how species fit, you must interpret the data.
Each species have its own tolerance for salinities. Freshwater fish desire a stable core of freshwater. If salinity goes over three parts per thousand, they is gone. Fish that love the mixing edge, such as snook, look for nutrient-rich seeps with a bit of brackish water. Mullet (forage) prefer a soft change in salt levels.
Use the calculator to know how it fits your target. Bass don’t like a thin lens; snook do. Trust your eyes, not the numbers.
The 40-to-1 rule is a beginning. Test in the water. Use a salinity refractometer or conductivity meter. Examine the water at dawn. That’s when layers are clearest. Recheck dusk. Erratic readings mean an unstable lens. Stable readings means a stable habitat.
The calculator provide a theoretical framework. Your observations verify reality. Until you seek the secret, water conceals itself. Hard work bring this clarity.