Invasive Species Spread Rate Calculator
Estimate aquatic invasive species range expansion from occupied area, fresh detections, dispersal distance, boat traffic, connected waters, reproduction, containment, and planning horizon.
📌Named spread scenario presets
⚙Spread model inputs
The model compounds yearly spread while reducing apparent growth when surveillance is weak.
Spread forecast
Calculation breakdown
🧬Species and vector grid
Mussel Fouling
River Carp
Benthic Fish
Plant Fragments
Trailered Boats
Flood Exchange
Bait Releases
Gear Transfer
📊Reference tables
| Species profile | Main spread mode | Natural multiplier | Boat multiplier | Early signal |
|---|---|---|---|---|
| Zebra or quagga mussel | Veliger drift, hull, bilge | 0.85 to 0.95 | 1.65 to 1.85 | Settlers on hard surfaces |
| Silver or bighead carp | River movement, eggs, floodplain | 1.85 to 2.15 | 0.75 to 0.95 | Young-of-year captures |
| Round goby | Bottom movement and bait transfer | 1.10 to 1.25 | 1.20 to 1.40 | Rocky shore detections |
| Northern snakehead | Canal movement and overland wet edges | 1.45 to 1.65 | 0.90 to 1.10 | Juveniles in shallow cover |
| Hydrilla or hyacinth | Fragments, mats, boat trailers | 1.35 to 1.80 | 1.85 to 2.35 | Fragments at launches |
| Vector | Best represented by | Multiplier range | Management focus | Model effect |
|---|---|---|---|---|
| Natural drift or swim | Dispersal distance | 0.90 to 1.15 | Barriers and flow pinch points | Expands occupied edge |
| Trailered boats | Weekly launch traffic | 1.65 to 2.05 | Inspection and decontamination | Adds satellite jumps |
| Bait bucket releases | Access sites and angler pressure | 1.25 to 1.50 | Bait rules and outreach | Adds patchy detections |
| Flood exchange | Connected floodplain waters | 1.45 to 1.75 | Post-flood survey sweeps | Raises connected-water exposure |
| Plant fragments | Fragments plus boat movement | 1.90 to 2.45 | Launch mats and harvest fragments | Boosts short jumps |
| Water setting | Connectivity multiplier | Distance behavior | Containment leverage | Notes for setting choice |
|---|---|---|---|---|
| Isolated pond | 0.45 | Slow unless moved by people | High | Use low connected-water count |
| Single lake basin | 0.75 | Mostly shoreline and launch spread | Medium high | Boat traffic matters most |
| Lake chain | 1.25 | Jumps between adjacent basins | Medium | Count navigable connected waters |
| Canal network | 1.55 | Linear and branch expansion | Medium low | Use confirmed canal reach length |
| River corridor | 1.80 | Downstream front can move fast | Low | Distance should follow water path |
| Containment effectiveness | Field meaning | Expected reduction | Residual issue | Use in calculator |
|---|---|---|---|---|
| 0 to 20% | Awareness only or weak enforcement | Minimal | Undetected jumps remain likely | Use for open access waters |
| 21 to 45% | Some inspections and removal | Partial | Missed boats or fragments | Good for seasonal programs |
| 46 to 70% | Regular decon and rapid response | Strong | Needs repeated coverage | Use when effort is documented |
| 71 to 90% | Barrier, quarantine, or intensive control | Very strong | Natural spread may persist | Reserve for enforced closures |
| 91 to 100% | Near complete containment | Extreme | Rare outside closed systems | Use only for physical isolation |
💡Calculation tips
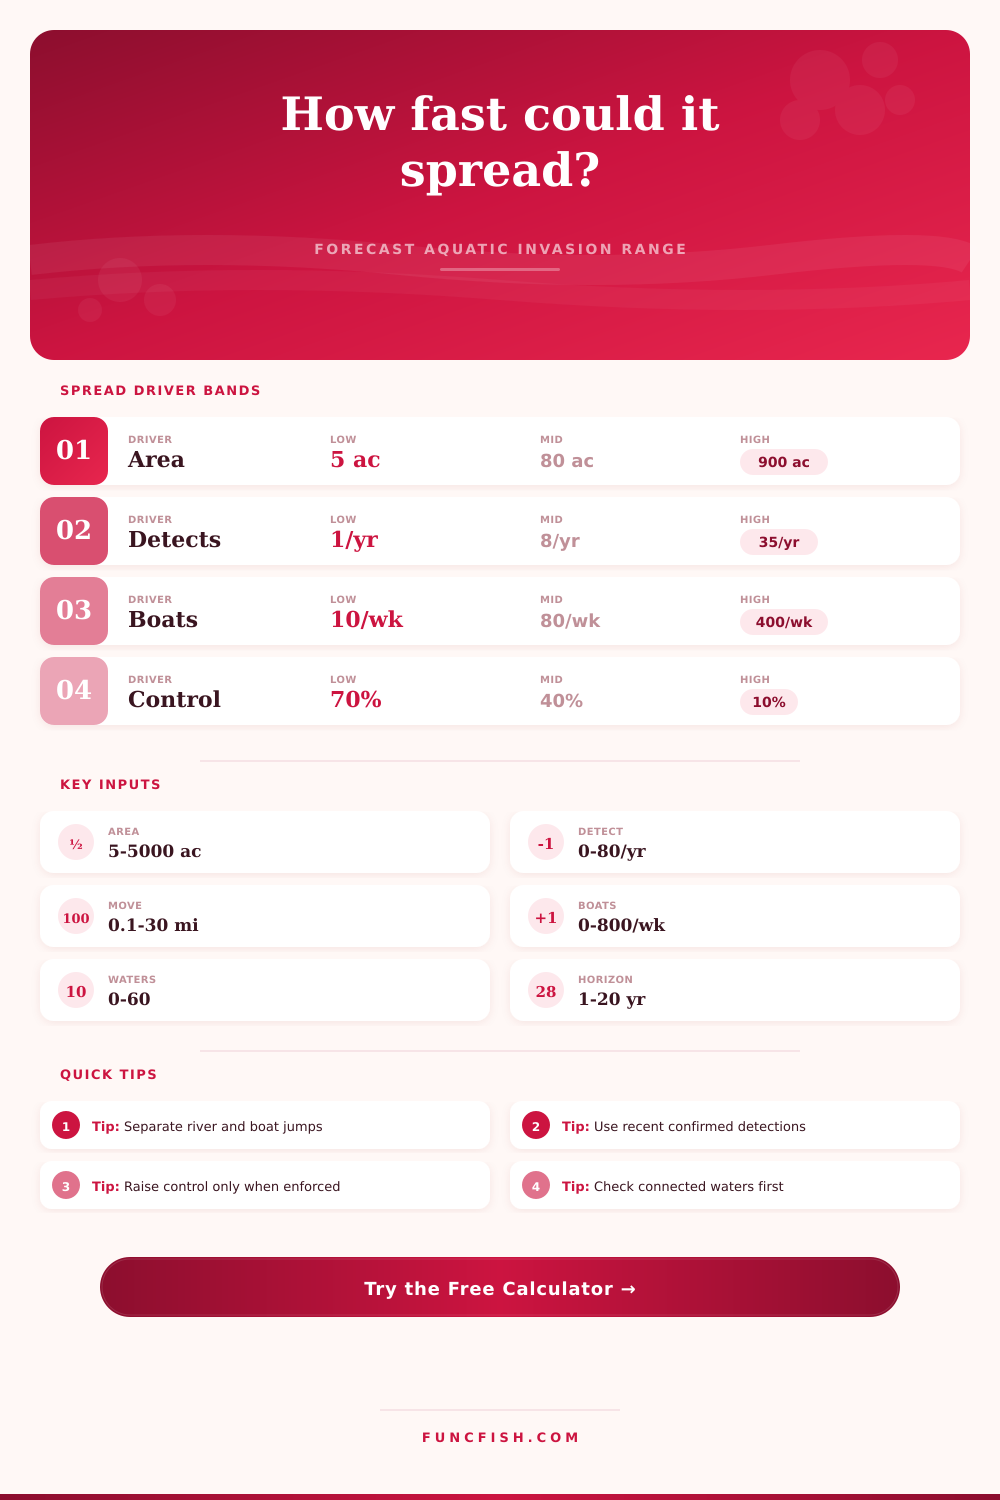
Tip: Enter dispersal distance along connected water paths, not straight-line map distance, because dams, culverts, canals, and flood routes change the reachable front.
Tip: Treat new detections as confirmed records from a consistent survey period; mixing old reports with fresh surveys can exaggerate annual spread rate.
Imagine a clear-water lake you fished with rock visible on bottom. Fast-forward a few years to that very same lake that’s now covered in thick mats of hydrilla or choked with invasive mussels. To the casual observer, the change seem sudden. But in reality, it’s been a gradual process that compounded over time. Most folks never even notice the process until its too late.
Understanding how fast an invasion might spread isn’t so much guesswork as it is understanding which pathways allow movement. Pathways are how organism jumps from one water body to another. The calculator does the math for you. However, if you don’t know what those inputs mean in real world, you can’t trust the output.
Why Boats Spread Invasive Species Faster Than Nature
That’s where most folks get fixated. They only consider biological potential of a given species. If a plant can reproduces fast, they think it’ll overrun an area faster then you can blink. It makes sense…until you take into account the vector data.
In aquatic systems, natural drift and swimming are rarely the primary drivers of rapid expansion. Boats do. A single boat with a trailer traveling from one lake to another is like having a teleportation device in your possession. You input weekly boat traffic coming from infested launches, and the tool handle the rest. High traffic doesn’t just mean more people fishing; it means more opportunities for larvae or seeds to hitch a ride in bilge water or on propellers.
More often than not when a high spread risk score occur, the reason is related to boat movement (outpacing nature-based barriers). The other variable is connectivity which, strangely, acts different here too. Downstream movement along a river corridor seems certain; that wave of expansion travels at speed of current and fills the corridor from end-to-end. By comparison, connecting two of those scattered pond requires nearly all human error (or floods) to fill in the gap between them.
To put it more simply, that same table on the page assigns multipliers to each type of water to show their expected growth range. Think “high” and “low.” For example, the higher the connectivity, the faster occupied area will expand year after year (assuming no human intervention). And conversely, an isolated pond will have a lower multiplier, yet a huge spike in occupied area due to just one containment-protocol screwup.
This is a small thing, but it would of help you decide where to best spend your limited monitoring resources. Managers also often fail to recognize blind spot in surveillance quality. You won’t detect new things if your surveillance is only good at peak season (e.g., summer). However, the plants becomes established in early spring. That is when they are easiest to remove and when many invasives are most vulnerable.
The model accounts for this by weighting the timing of detection coverage with time horizon: If you have low coverage now, you’re probably underestimating how far out the infestation must be, i.e., what’s realy going on. So when the explosion of sightings finally happens, it appears surprising, not predictable, as in “oh, we knew that would happen.” It’s the difference between noticing a leak when it’s a drip vs. After the ceiling collapses.
The most difficult input to make an honest estimate for is containment effectiveness. Agencies with inspection stations tends to show very high effectiveness numbers. But real world decontamination success and enforcement rates can wildly swing either way. You don’t want your estimate to be dangerously optimistic if field reality is that there are sporadic checks at best. Erring on the side of caution is better.
Increase the containment input if and only if the protocol is being strictly followed. That way the model won’t lull you into a false sense of security.
The breakdown section allows you to see what’s contributing to the final risk score. If it’s low containment and lots of boat traffic that’s doing the heavy lifting, then you know where to concentrate your interventions. Because what we’re after isn’t so much an estimate on the scale of the infestation, it’s your window. It is your window of opportunity. Because there’s only one chance to contain it. And it’s always the first few years.
If you wait for confirmation, you’ve waited too long if you’re facing snakehead in a canal web or zebra mussels in a marina chain. Now, you do need a baseline, and that’s what the tool provides. The rest is up to you out in the field.
Vigilant eyes translate data into action. You begin by recalling the clarity of the water, but now you catch the spread before it becomes a story. That’s the point. The goal is to continue keeping it clear.