Seine Haul Estimate Calculator
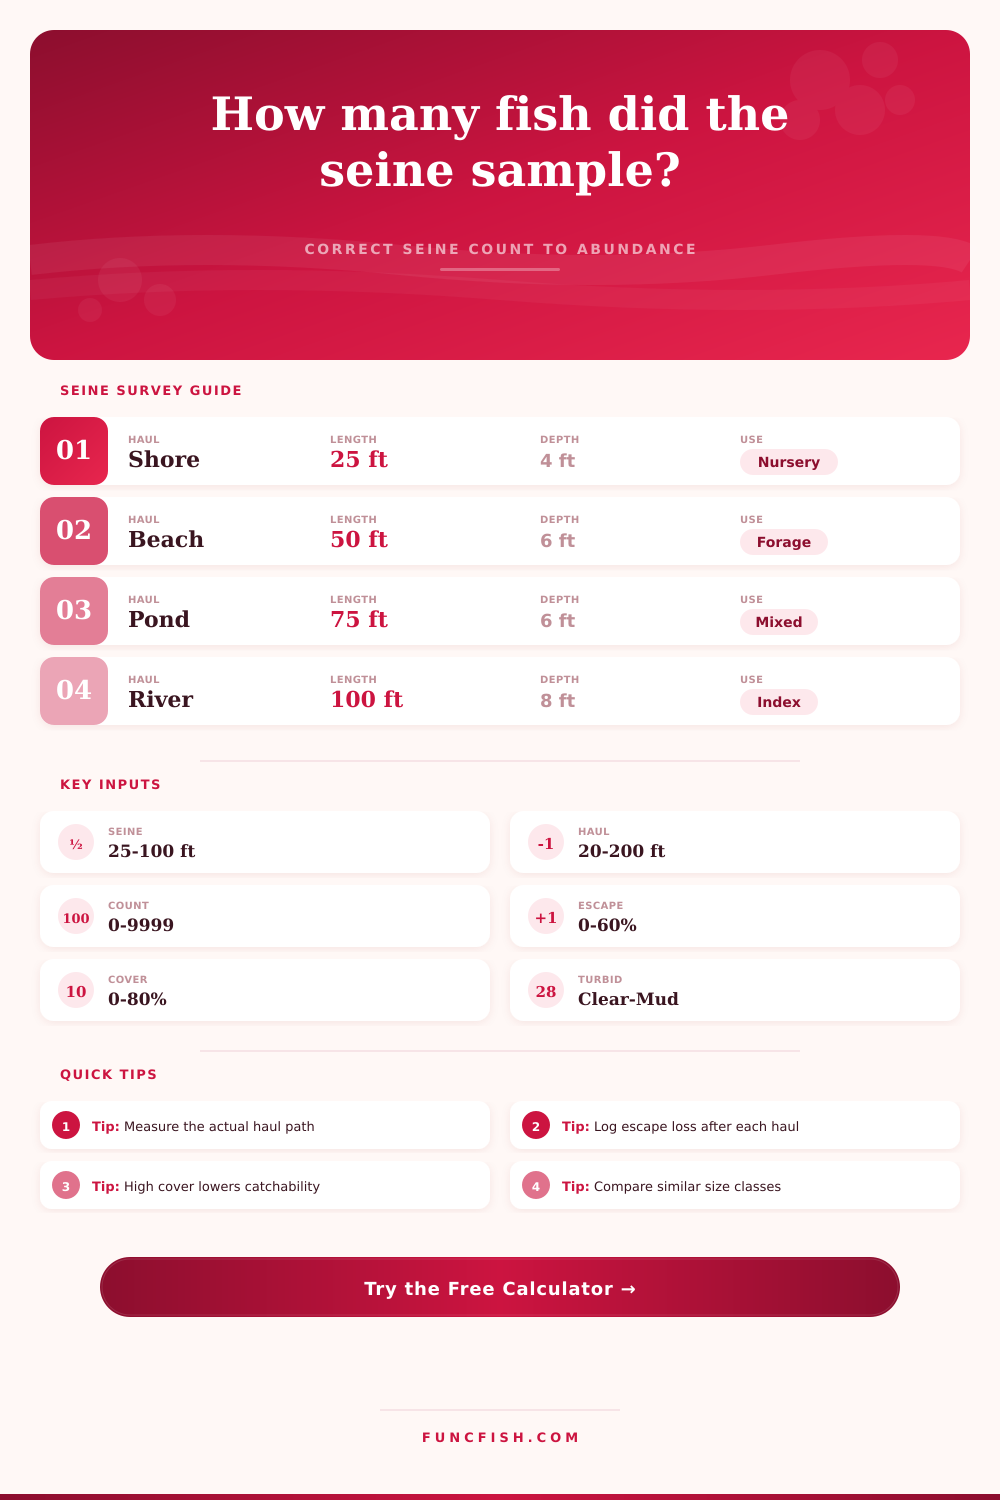
Estimate corrected fish abundance from seine dimensions, haul distance, swept area, observed count, escape loss, habitat cover, turbidity, species, and size class.
📌Seine survey presets
⚙Haul inputs
Corrected seine haul estimate
Full breakdown
📋Species and seine gear grid
Minnow / Shiner
Sunfish
Darter / Benthic
Beach Seine
📊Reference tables
| Survey preset | Typical seine | Haul distance | Primary estimate |
|---|---|---|---|
| Pond nursery edge | 15-30 ft / 4-6 ft | 20-60 ft | Fry density |
| Beach forage index | 50-100 ft / 6-8 ft | 60-180 ft | Forage CPUE |
| Stream block haul | 10-25 ft / 4-6 ft | 10-40 ft | Benthic density |
| Wetland margin haul | 25-50 ft / 4-6 ft | 30-90 ft | Mixed assemblage |
| Reservoir cove haul | 50-75 ft / 6 ft | 50-120 ft | Young fish index |
| Species group | Baseline q | Size response | Field note |
|---|---|---|---|
| Minnow / shiner | 0.68 | High for juveniles | Schools ahead of net |
| Sunfish / bluegill | 0.58 | Lower in cover | Uses weeds and wood |
| Bass young-of-year | 0.52 | Good for small fish | Edges and coves |
| Darter / benthic | 0.43 | Depends on contact | Bottom escape risk |
| Shad / open forage | 0.61 | Better in open water | Fast schooling fish |
| Carp / sucker juvenile | 0.47 | Lower when larger | Strong net avoidance |
| Condition factor | Low setting | High setting | Effect on estimate |
|---|---|---|---|
| Habitat cover | 0-15% | 60%+ | High cover raises estimate |
| Turbidity | Clear | Muddy | Muddy water can improve approach |
| Escape correction | 0-10% | 35%+ | Higher escape raises abundance |
| Depth coverage | 50% | 90%+ | Low coverage lowers q |
| Effective width | 45% | 85%+ | Changes swept area directly |
| Density class | Fish per 100 m² | Fish per acre | Interpretation |
|---|---|---|---|
| Very low | 0-10 | 0-405 | Sparse catch |
| Low | 10-35 | 405-1416 | Patchy abundance |
| Moderate | 35-100 | 1416-4047 | Consistent catch |
| High | 100-250 | 4047-10117 | Dense aggregation |
| Very high | 250+ | 10117+ | Strong concentration |
💡Survey checks
Tip: Keep the effective width realistic. A bowed or poorly closed seine usually samples less area than the full headline length suggests.
Tip: Compare density only among hauls with similar depth, cover, turbidity, gear mesh, and target size class.
There were eighty-six fish on the net. Pull it up, count them out. But that’s just the beginning of the story. All that other stuff, the missed shot, the mud, and the mesh, holds the remaining data. To get a good idea of true abundance, a seine haul needs something more than a tally counter. It needs you to face reality. What did the gear sample? And what didn’t it sample?
Plug in the details of your conditions into this calculator and let it do the math. You don’t have to guess about the ones that slipped through the cracks. That’s what it all boils down to: how easy the fish are to catch. A seine doesn’t capture every single fish. Some slip under the lead line, some get ahead of it, and some tuck into weeds as the net passes over them.
How to Count Fish Accurately
You have to consider that lost fish. Otherwise, you’re going to underestimate the density. Particularly with benthic species such as big juveniles or other darters that has plenty of time to avoid the mesh. By including an escape correction factor, the tool takes that into account. Your escape rate may be fifteen percent, so you believe you captured everything, but you’re only seeing a small portion of the population. Adjusting for escape puts you in the realm of what’s really there, not what’s optimistically imagined.
Then there’s the habitat angle. Fish is never spread evenly across the bottom of any lake. Cover concentrates them. If you’re hauling through an area with 30% vegetation, you aren’t sampling open water. You’re sampling a complex, three-dimensional maze that the seine doesn’t handle well. This is why the cover factor is built into the calculator. It recognizes that higher levels of structural complexity lead to lower relative efficiency. It only takes a small input change, but it makes a big difference to the resulting output.
Even if you have exactly the same number of fish, you’ll always find a haul in a dense stand of cattails looks richer then one hauled in an area of clear, open sand. The strange thing about this equation is the effect of turbidity. Everyone thinks clear water is best for fishing, but worst when seining. The fish spot the net. They see the seine approaching and flee by the time you close the ends.
Turbid water (muddy or even tannic) blurs their vision so the seine gets in closer before they detect it. Many biologists prefer slightly turbid conditions because they seem to catch more. The tool accounts for this too, knowing that cloudiness affects how the fish behave. Your raw counts will be suppressed in crystal clear water due to fish evasion. The correction adjusts this and makes things more comparable to those mucky pond surveys in which the fish never spotted the net until it was too late.
The geometry of your gear also affect results: What happens if your environment is 6 feet deep and you use a 50-foot long seine? It doesn’t form a nice rectangular sweep; the lead line pulls through unevenly, and the headline sags and bows out. Its actual effective width isn’t going to be the entire length of the headline. How much of the net do you think is actually doing any work?
To make that adjustment for sag, the calculator asks you how wide your net is. Because if you’re assuming your net is straight when really it’s bowing outward, you’ll underestimate its density and overestimate the area it sweeps. Experience helps get this one right, but it makes all the difference between a solid estimate and a mere guess.
Because of how they behave, certain presets are appropriate for each species. Carp tend to hang on the bottom; shiners and other schooling forage fish don’t. Shad suspend out in open water, whereas sunfish tuck into structure. These natural behaviors inform the species-specific baseline catchability numbers built into the tool. One size does not fit all; all fish do not behaves the same toward our gear.
If you apply an incorrect coefficient, it will throw off your ability to compare among various survey locations. It is better to be consistently wrong rather than right with your number, but it is even more important to be accurate enough that you can use those numbers to make management decisions. You don’t need to catch all the fish. You just want an index that you can duplicate and see how the population changes over time. With density estimates you know how much you caught compared to last year. Consistent input is what drives the trend.
That is laid out in the reference tables on the page. They explain which kinds of gear work for each type of survey purpose. Looking for forage abundance? Nursery success? Either way it’s a matter of measuring, correcting, then standardizing.
So in the end, it’s a snapshot of a dynamic system, a seine haul. And the numbers won’t always be perfect, but they can be honest. We account for gear inefficiency, cover, and escape. Raw counts become meaningful data. The calculator does much of the work for us, but our experience and eyes add the context. That’s how we go from a bag of wet fish to an ecological story. Pull the net; count the catch; look deeper.