Spring Warmup Rate Calculator
Estimate how quickly fishing water is warming, when a species temperature trigger may arrive, and whether the current pattern is stable enough to trust.
📌Scenario presets
⚙Warmup settings
Spring warmup forecast
Formula breakdown
🌡Thermal profile grid
Shallow Cove
Farm Pond
Reservoir Arm
Main Lake
River Run
Tailwater
Marsh Flat
Tidal Creek
📊Spring temperature references
| Species group | Activity trigger | Spawning window | Base degree temp | Warmup response |
|---|---|---|---|---|
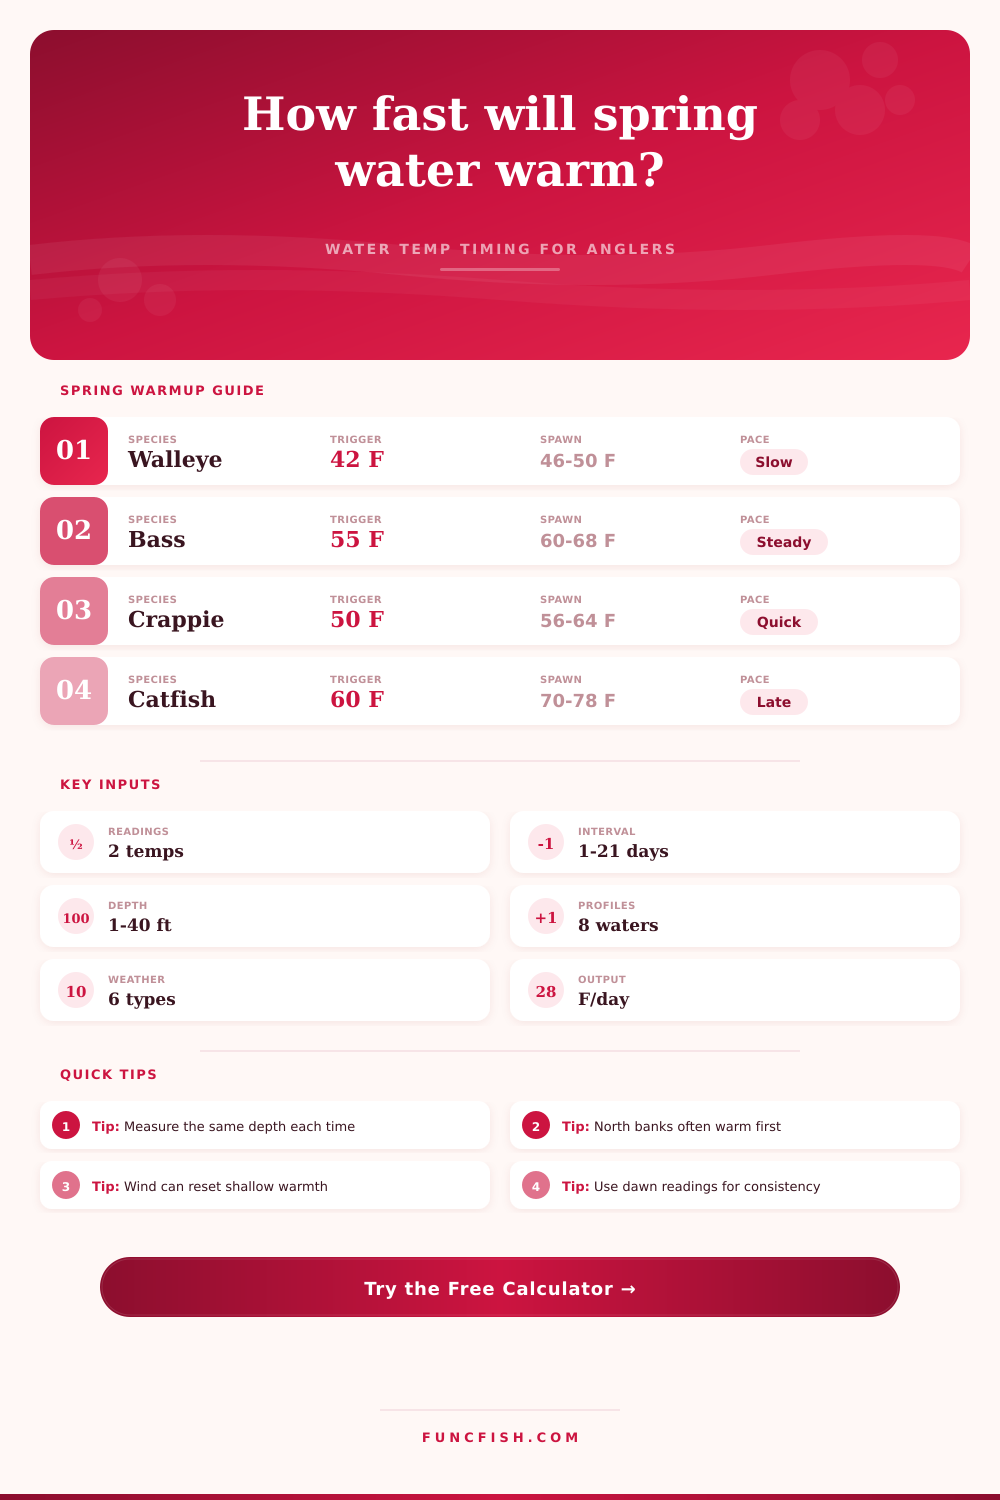
| Largemouth / smallmouth bass | 55 F / 12.8 C | 60-68 F / 15.6-20 C | 50 F | Stable shallow gains help fish commit |
| Crappie | 50 F / 10 C | 56-64 F / 13.3-17.8 C | 45 F | Fast cove warming can pull fish shallow |
| Walleye | 42 F / 5.6 C | 46-50 F / 7.8-10 C | 38 F | Small changes matter early in spring |
| Trout | 44 F / 6.7 C | 48-55 F / 8.9-12.8 C | 40 F | Moderate warming often improves feeding |
| Northern pike | 40 F / 4.4 C | 42-48 F / 5.6-8.9 C | 36 F | Very early shallow-marsh movement |
| Catfish | 60 F / 15.6 C | 70-78 F / 21.1-25.6 C | 55 F | Needs a stronger late-spring signal |
| Bluegill / panfish | 52 F / 11.1 C | 67-75 F / 19.4-23.9 C | 48 F | Warm pockets show first activity |
| Striped bass | 50 F / 10 C | 60-68 F / 15.6-20 C | 45 F | Tracks bait movement along flats |
| Water profile | Heat factor | Typical lag | Warming behavior | Reading caution |
|---|---|---|---|---|
| Protected shallow cove | 1.35 | 0.7 day | Warms early and cools fast after wind | Check afternoon and dawn spread |
| Small farm pond | 1.25 | 0.9 day | Responds quickly to sun and warm rain | Mud bottom can exaggerate surface readings |
| Reservoir creek arm | 1.05 | 1.6 days | Moderate warming with inflow influence | Compare stained water to clear main lake |
| Main-lake basin | 0.72 | 3.4 days | Large volume smooths daily changes | Surface may not match fish depth |
| River run | 0.86 | 1.2 days | Flow mixing mutes sunny-bank gains | Gauge water can lag air temperature |
| Dam tailwater | 0.55 | 4.0 days | Release depth controls temperature | Tailrace readings can be site specific |
| Marsh flat | 1.42 | 0.5 day | Very quick warmup in skinny water | Wind can erase a warm surface layer |
| Tidal creek | 0.92 | 1.8 days | Tide exchange blends warm and cool water | Measure at the same tide stage |
| Weather pattern | Modeled heat | Night loss | Confidence | Calculator effect |
|---|---|---|---|---|
| Clear warming trend | 3.0 F/day | 0.5 F | 88% | Strong positive warmup forecast |
| Cloudy but stable | 1.4 F/day | 0.4 F | 82% | Slow but dependable rise |
| Post-front chill | 0.5 F/day | 1.4 F | 76% | Can stall or reverse shallow gains |
| Cold rain or runoff | 0.2 F/day | 1.8 F | 68% | Reduces trend and confidence |
| Sunny with strong wind | 2.1 F/day | 1.1 F | 74% | Sun warms surface, wind mixes it down |
| Warm nights and light wind | 2.6 F/day | 0.1 F | 90% | Best persistence for a shallow pattern |
| Blended rate | Spring signal | Likely fish response | Pattern reliability |
|---|---|---|---|
| Below 0 F/day | Cooling | Fish may slide deeper or suspend | Low until temperatures stabilize |
| 0-0.5 F/day | Holding | Early fish remain selective | Moderate if nights stay mild |
| 0.5-1.5 F/day | Steady rise | Reliable movement toward warm banks | High for repeatable locations |
| 1.5-3.0 F/day | Fast rise | Shallow bite can change by afternoon | Medium because timing shifts quickly |
| Above 3.0 F/day | Spike | Surface warmth may outrun deeper fish | Lower unless warmth persists overnight |
💡Calculation tips
Measure repeatably. Warmup rate works best when both readings come from the same depth, same bank type, and similar time of day. Dawn readings reduce afternoon surface spikes.
Treat wind as a reset. A sunny pocket can warm fast, but sustained wind mixes that warmth through the water column. Use the exposure setting to keep the forecast realistic.
You’re standing on the bank thinking the fish should be up there but it’s cold out. The wind is blowing and ice is off. This is a specific moment where intuition often fails. Water take longer to warm than the air.
What about the warmer days? What about the cooler nights? It combines what you’ve recorded with water body properties and calculates how quickly that heat is being absorbed by the water. Does it believe that pattern will hold long enough for you to rely on it? The tool can give you a solid date on when certain species should be moving around based off your vague feeling that spring is coming.
How to Know When Fish Will Move in Spring
To do this, you take two temperature measurements a certain number of days apart, and divide difference between them by that number of days to get the perceived rate of warm-up. But here’s where observation stops being half the equation. How fast does your water warm up depend not just on its inherent properties but also how exposed it is. For example, a windy main lake basin will warm less efficient than a sheltered cove. So the air temp will result in varying water temps.
To make up for this change, the tool factors in a heat rating based on your location type. A marsh flat might have a heat factor of 1.42 because it warms rapidly thanks to shallow depth and dark bottom cover. 05 because it warms at a relatively slower rate. That makes all the difference because fish is reacting to the amount of heat that accumulates in their own microhabitat, not the overall lake average.
Any thermal prediction has a lot of variance depending on the weather. Calm nights with a clear warming trend allow that heat to stay around longer. So they increase confidence level of that prediction. But strong winds can cause a sudden chill after a front, mixing what little warmth had built back up to the surface and sending it down deeper into colder water. It basically resets the clock. So don’t think those fish will respond like the water’s permanently warmer just because you saw a spike at noon on an otherwise sunny day but it was cold and windy out that night. Those weather inputs change the calculator’s stability score accordingly, letting you know if that quick rise may be deceiving. This lets you tell if this is just a temporary rise in surface temperature or a true change in water column.
That change moves them to the shallows and onto the spawning grounds. It’s also important to understand that different species have unique thermal triggers. For example, walleye will begin to make their move when the water temperature reaches 42 degrees Fahrenheit. Bass generally won’t budge until the water reach 55 degrees or more. Crappie typically get going fairly fast once those coves reaches 50 degrees. So they are sensitive to even modest warmup rates early in the spring. Catfish on the other hand need really hot water. They’ll often hold out until late spring when the whole lake warms up. Your choice of target species establishes the finish line for your race.
From there the calculator determine how many days you have before your desired water temperature is reached. It takes into account the expected delay from changing air temps and the water temp response. Finally, make sure that you’re consistently taking your water temperatures at the same depth and time. For instance, surface water temperatures change drasticly during the course of a day. Wind has an exaggerated effect on water temps and the lower sun angle of spring makes this situation worse. Try to take your readings at roughly the same depth and time of day.
Ideally, I prefer taking dawn readings since these represent the “true” starting point for a day’s worth of solar warming. Taking a reading at high noon following a bout of sunny weather may give you a false impression of what the fish are experiencing in terms of habitat temperature. It’s about knowing the momentum of the temperature and not so much what the actual temperature is. Half a degree rise each day can be more productive then having a spike of three degrees in one day then crashing back down. The fish want to see consistency and not necessarily the heat.
That’s where the pattern stage comes into play. The pattern stage output helps you gauge if conditions are reliable enough to press the advantage or if you should hold back until they stabilize. Do I go after the points and try to capitalize on the fish being up there or do I wait for things to stabilize? Matching weather with numbers will increase your odds of locating active fish greatly.
Fishing in the spring is more about timing and patience than it is luck. Following the true thermal trend gives you a clear advantage over guys that are responding to what they think the water was doing from last week. It doesn’t have anything to do with the calendar. The water remembers. Start keeping a log of this stuff and you’ll quickly start to notice patterns. These pattern tell you when and where those fish are going to move. That understanding makes for a predictable day on the water as opposed to a frustrating one.