Water Body Productivity Class Calculator
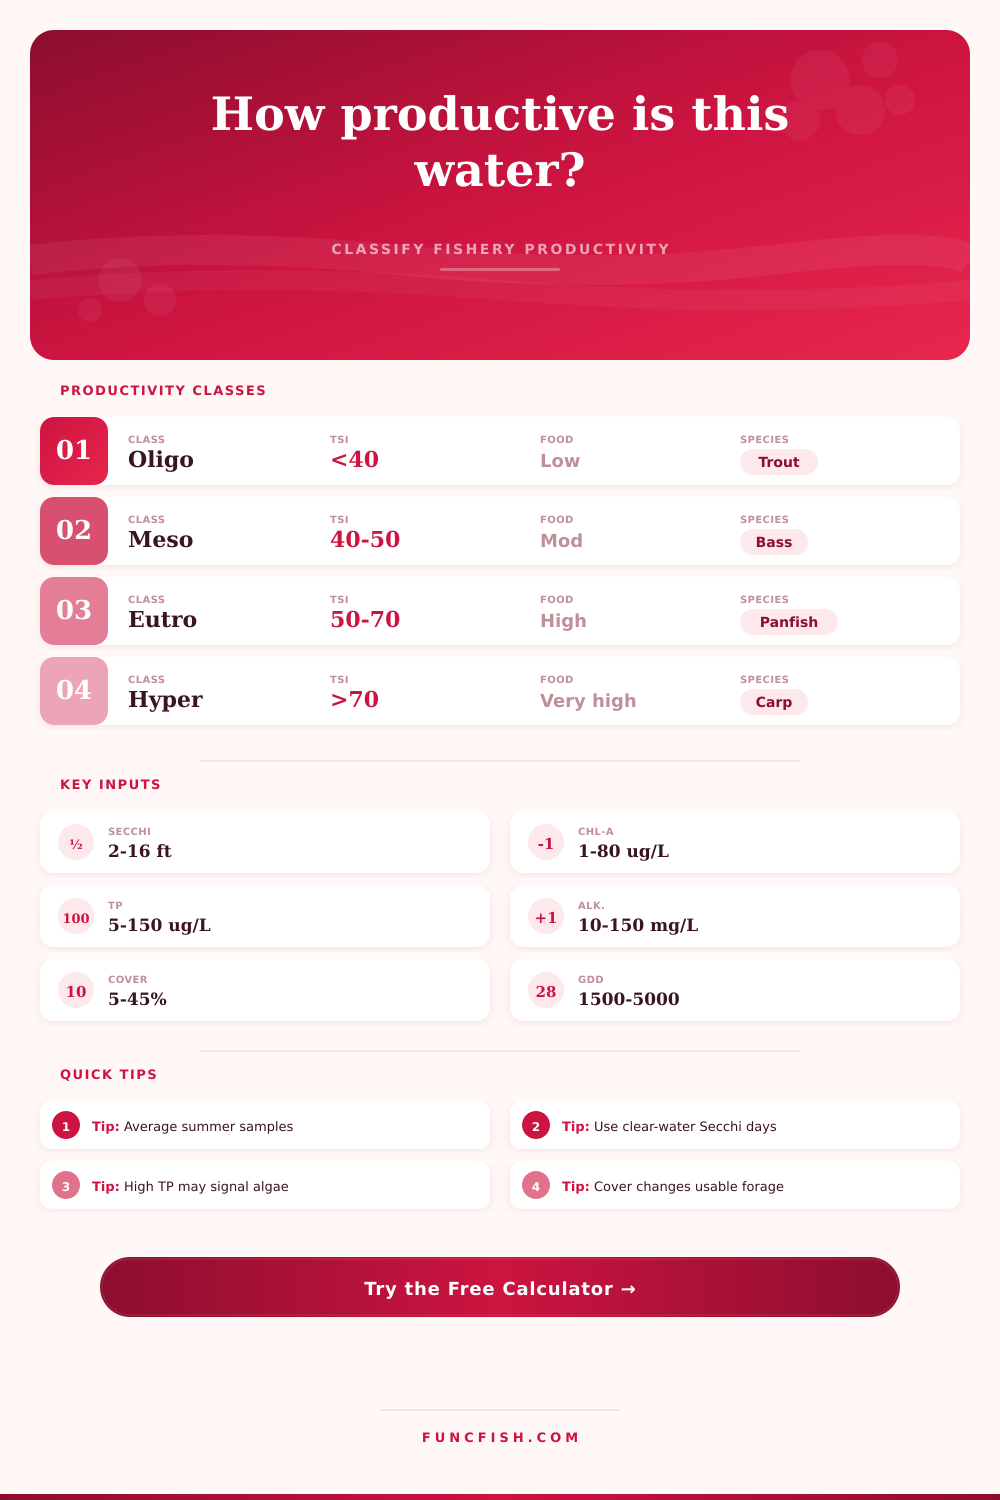
Classify fishery productivity from water clarity, chlorophyll, total phosphorus, alkalinity, basin size, mean depth, cover, and growing degree days.
📌Lake, pond, and reservoir presets
⚙Productivity inputs
Fishery productivity forecast
Full breakdown
🐟Productivity and species grid
Oligotrophic
Mesotrophic
Eutrophic
Hypereutrophic
📋Reference tables
| Trophic class | Carlson TSI | Secchi depth | Chlorophyll-a | Total phosphorus |
|---|---|---|---|---|
| Oligotrophic | Under 40 | Over 13 ft / 4 m | Under 2.6 ug/L | Under 12 ug/L |
| Mesotrophic | 40-50 | 6.5-13 ft / 2-4 m | 2.6-7.3 ug/L | 12-24 ug/L |
| Eutrophic | 50-70 | 1.6-6.5 ft / 0.5-2 m | 7.3-56 ug/L | 24-96 ug/L |
| Hypereutrophic | Over 70 | Under 1.6 ft / 0.5 m | Over 56 ug/L | Over 96 ug/L |
| Alkalinity band | mg/L as CaCO3 | Productivity meaning | Calculator modifier |
|---|---|---|---|
| Very soft | Under 20 | Limited buffering and plankton response | Reduces yield |
| Soft to moderate | 20-50 | Usable but usually modest fertility | Slight reduction |
| Moderate to hard | 50-150 | Good carbonate reserve for fish ponds | Full support |
| Very hard | Over 150 | High buffering, watch bloom intensity | Small cap |
| Habitat cover | Cover percent | Fishery effect | Common concern |
|---|---|---|---|
| Sparse | 0-10% | Forage and ambush space are limited | Low recruitment |
| Balanced | 10-30% | Good nursery and predator access | Manage edges |
| Dense | 30-50% | Strong refuge but harder predation | Stunting risk |
| Choked | Over 50% | Productivity becomes less available | Oxygen swings |
| Fishery lane | Best TSI window | Useful GDD base 50 F | Notes |
|---|---|---|---|
| Coldwater trout | 30-45 | 900-2600 | Clear, deep, low algae |
| Bass and bluegill | 45-62 | 2400-4800 | Most balanced pond lane |
| Walleye reservoir | 40-58 | 1800-3800 | Moderate fertility and open water |
| Catfish or carp-tolerant | 58-78 | 3000-5600 | Warm, fertile, oxygen watch |
💡Calculation tips
Tip: Use summer averages for Secchi depth, chlorophyll-a, and total phosphorus. A single storm sample can push the trophic score higher than the fishery usually experiences.
Tip: Treat the yield result as a planning class, not a harvest quota. Oxygen, winterkill history, forage balance, and angler harvest can move real production up or down.
There you are holding a Secchi disk in one hand and a dipnet in the other. On a calm afternoon, you can see down six feet. The water appears clear. It’s a prime trout lake, your intuition tells you. This is a clean, inviting body of water. But your intuition isn’t a very good management tool.
The thing about water clarity is that it tell you about light penetration, not food availability. In fact, a clear lake could actualy be a biological desert without any algae to get the food chain going. On the other hand, a murky pond may be a biological engine churning out bass and bluegill at high levels. The key? Productivity. Productivity sounds like an academic word but in this case it just means amount of life the water will support. To see beyond the shine on the surface, you’ve got to look below.
Why Clear Water Is Not Always Good
Once you know what’s in the water and have an idea about size of the basin, you can just plug those numbers into the calculator above and let it do the work for you (rather then guess at how all these variables might interact). It takes the numbers for clarity, phosphorus, and chlorophyll, and rolls them into one number; called the trophic state index. Which becomes pulse of the fishery. Instead of merely being a point-in-time measurement, it asks whether the fishery have the materials required to produce biomass.
In most freshwaters, it’s phosphorus that limits growth. Algae won’t grow, zooplankton will starve, and the fish won’t be happy without it. But phosphorus isn’t the entire equation. Alkalinity is an odd factor because it actualy helps make the shells of plankton by buffering the water chemistry. If alkalinity are low, then even though there may be phosphorus available, the biological machine will grind to a halt. So it’s a little chemical tidbit that determines the yield ceiling.
The nutrient equation changes when habitat enters the picture: You can end up with an extremely productive nutrient-rich lake that has no keepers in it at all because they never grow big enough. Dense cover gives fish a sense of security… But it breaks down the food chain into small isolated pockets that stunt their growth. And that’s where the page’s reference table comes in: Ten to thirty percent balanced cover give the young fish room to thrive in the nursery without sacrificing predator hunting efficiency. Less cover leaves the fry exposed, and too much cover make it hard for them to reach the food. You’ve got to find the right mix of nutrients and physical livig space for the fish.
Growing degree days are a measurement of the heat energy that can be used by biology. Climate is the accelerator. Metabolism and reproduction accelerate at higher temperatures. For example, phosphorus-rich, warmer southern ponds will turn over more biomass compared too an equally chemically rich but colder northern lake. Trout need cold water (low nutrients + high clarity), whereas a catfish lane work well on a warmer, high-nutrient system. The tool considers the temperature and won’t let you expect trout to thrive in a warm, weedy pond or bass to perform well in a coldwater system. That’s just not sustainable. Matching your fish species to both the nutrient and thermal profile matter.
Clear water is nice; it feels clean and virtuous, people chase clarity as if it were a virtue. But clear water frequently mean poor productivity. To get a productive fishing hole you have to come to terms with some algae. Green can be gold, and the key is controlling how much there is. Overly nutrient-rich systems collapse on their own weight, creating algal toxins and oxygen crashes. Mesotrophic to moderately eutrophic waters are generally the goal of achieving an optimal balance. They contain sufficient food to support growth without degrading water quality to hazardous limits.
Keep this in mind while taking your samples: Sampling time is important. Collecting in mid-summer is best. It’s when there’s the most biological activity. Early spring samples might just be muddy water from runoff instead of green algae, whereas late-fall samples might have dead plankton and low temperatures that lead to very clear water. This is a snapshot, not necessarily representative of entire year. The fishery class is based on the annual average, not some brief moment in time. Get an average of your summertime samples to really get a baseline. You don’t want the noise but the signal.
The bottom line is that water management is all about expectations and if you’re getting input data indicating an oligotrophic class, then there’s no sense in forcing bass production with over fertilization. Instead, you’ll probably end up with nuisance algae blooms. If you have a naturaly fertile water body, accept the potential for catfish or panfish and don’t fight it. The calculator helps you see the landscape before you begin to dig, and it gives you the power to make murky water a manageable resource.
Again, you’re standing on the dock… but now you’re not staring at the surface. Now you’re reading the habitat, the heat and the chemistry, and you understand what the water is capable of doing. And that’s worth more than one dip off the Secchi disk.